Lecture 34
Introduction
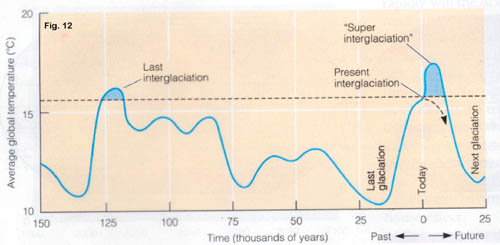
 So, here we are settled nicely inside an Icehouse
age, and probably to remain there for many millions of years. Nevertheless, as
clearly shown in Figure
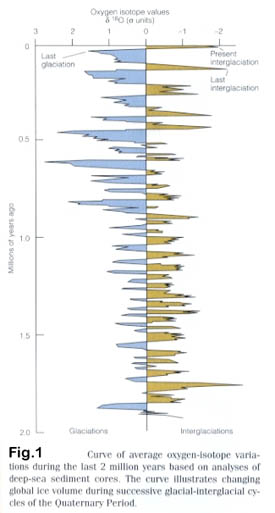
1 (which we saw before), we are currently sitting very close to the
glacial/interglacial boundary condition and tend to oscillate back and forth
across it - probably in response to the Milankovitch factors. Roughly 21,000
years ago the Earth was at a glacial maximum; the climate was cold, dry, and
windy. Large mammals now extinct, such as mammoths, saber-toothed tigers and
giant sloths, were hunted by our ancestors.
So, here we are settled nicely inside an Icehouse
age, and probably to remain there for many millions of years. Nevertheless, as
clearly shown in Figure
1 (which we saw before), we are currently sitting very close to the
glacial/interglacial boundary condition and tend to oscillate back and forth
across it - probably in response to the Milankovitch factors. Roughly 21,000
years ago the Earth was at a glacial maximum; the climate was cold, dry, and
windy. Large mammals now extinct, such as mammoths, saber-toothed tigers and
giant sloths, were hunted by our ancestors.
In this final lecture we will look at a couple of interesting climatic events since that glacial maximum, examine the current anthropogenetic effect on climate, and then speculate upon the future.
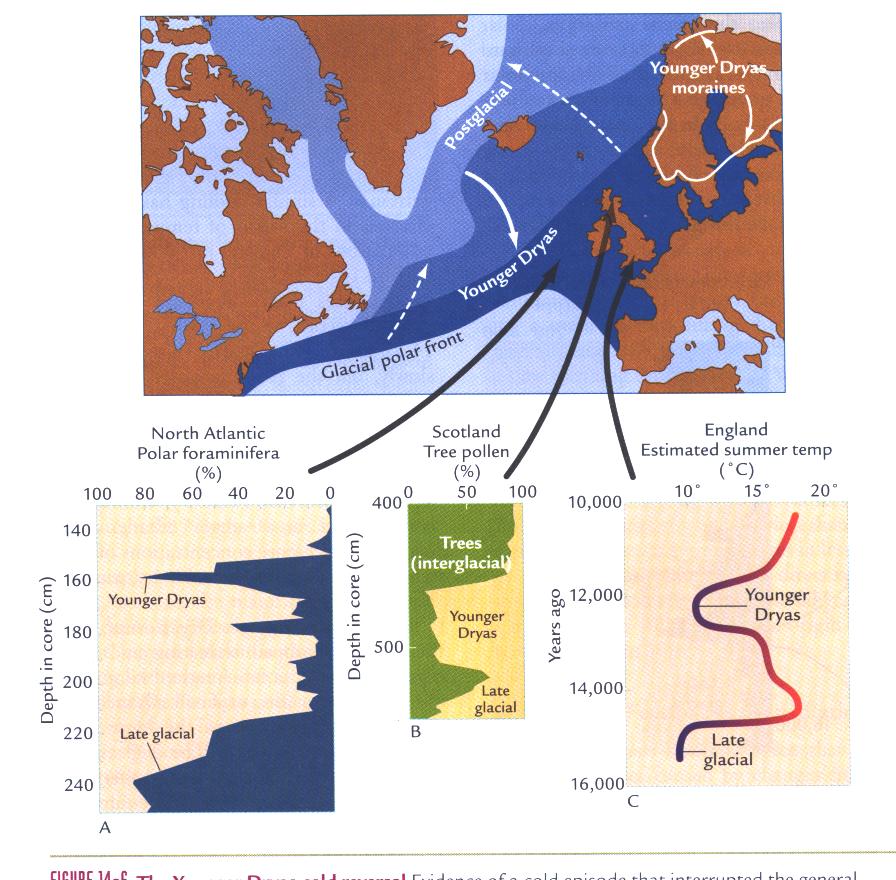
The Younger Dryas Event
As global climate warmed from the 21,000 glacial
maximum, one dramatic cooling event, called the Younger Dryas Event, occurred
and is well documented in pollen records (from an Arctic plant called Dryas)
from Europe. As the North American ice sheet melted back to the north, starting
at about 15,000 years ago warm water flowed northward along the European coast.
For 2000 years, the climate warmed; ice sheets were melting, plants and animals
were reoccupying the deglaciated lands, sea ice in the
The effects of the Younger Dryas Event are most pronounced around the
The Little Ice Age
As the last millennium began, scattered evidence from Europe and the high
latitudes of North America suggests a time of relatively warm climate near 1000
to 1300 called the Medieval Climatic Optimum; interestingly, this
coincides with a very 'liberal' time of learning through much of Europe (I
guess if you don't have to worry much about crops and freezing to death, you
have time to work on cultural things)! During this time, Nordic people
settled southwestern
Worldwide temperatures were not actually vastly
colder than at present: just 1o to 1.5oC lower.
However, the practical impact of this small drop in temperature was profound.
Alpine glaciers in the
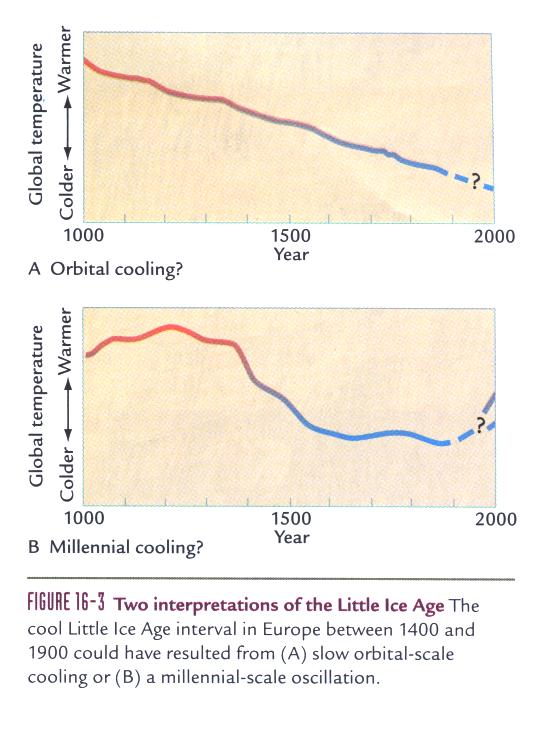
So, what factors influenced the beginning, duration
and end of the Little Ice Age? Take a look at Figure 3; this is
a record of climate change as interpreted from
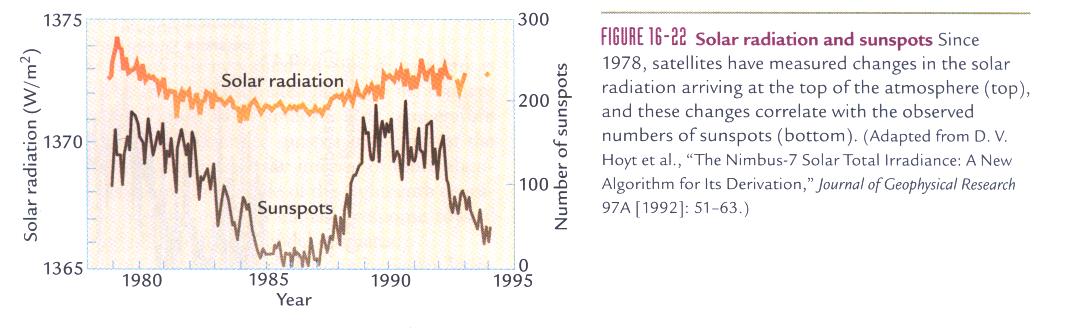
By the way, there is another theory: millennial-scale changes in the Sun's strength have been hypothesized as a cause of millennial climatic oscillations, but the evidence really weak! We've not been collecting data for very long (precise measurements started in 1978), but there seems to be a cyclical variation in radiation of 11 years (Figure 5) (This cycle is supported by astronomical observations - but not precise measurements - over very many decades). Climatic models indicate that a change of 0.15% in the Sun's strength could alter global mean temperature by as much as 0.2oC if it persisted for a long time. For an 11-year cycle, however, the 5.5- year interval between minimum and maximum does not allow the climate system enough time to register a full equilibrium response. So, it's unlikely that any variation in Sun activity produced the Little Ice Age.
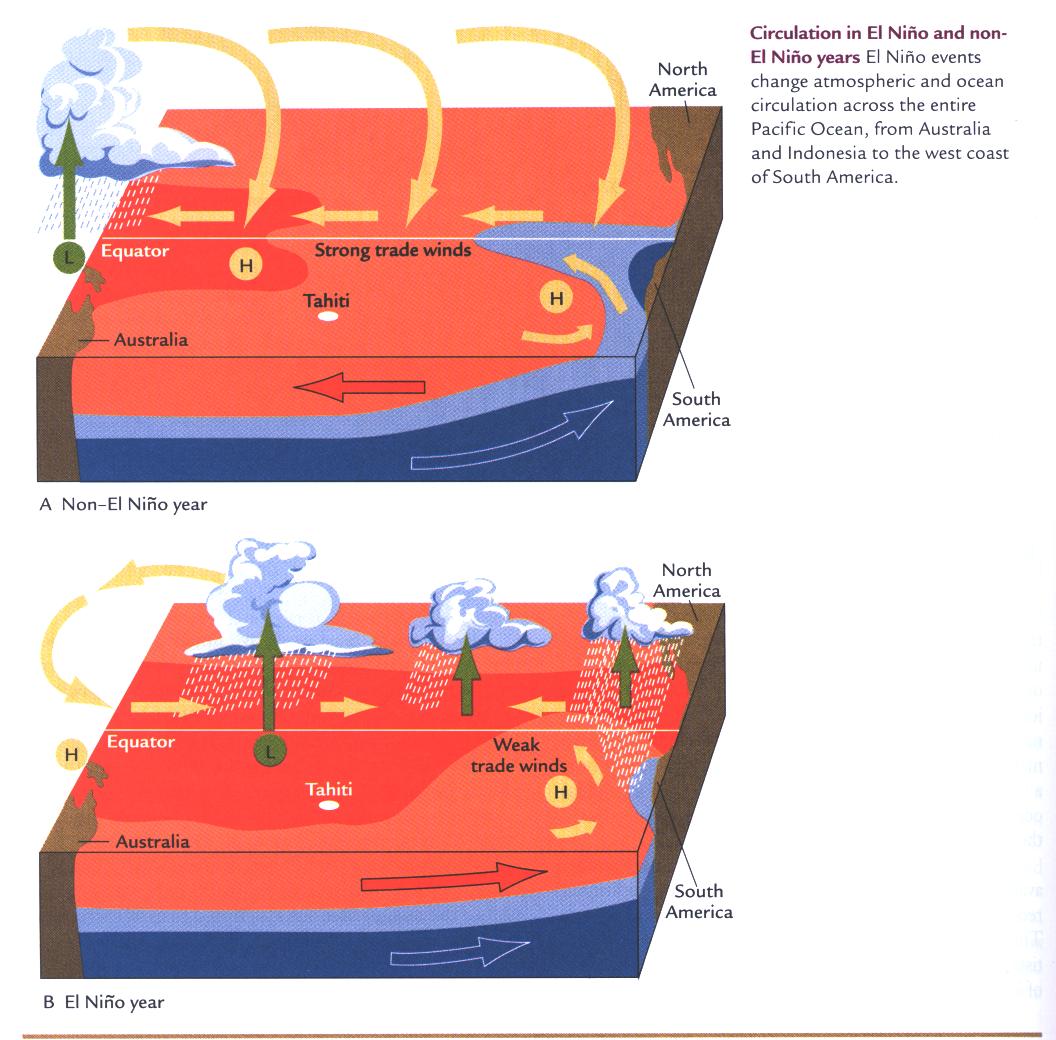
We can't give up without looking at one other
possible factor: an unusual series of El Niño
events. As you know, El Niño is an ocean circulation
pattern that interrupts the normal circulation pattern in the
El Niño years change all this. During El Niño winters, strong winds fail to blow in the eastern and tropical Pacific, upwelling does not occur, and the surface waters near the coast are warm. The resulting effects on sea life and humans along the South American coast are devastating. El Niño warming of surface waters near the coast also produces large amounts of moisture, leading to cloudbursts, flash floods, and a whole series of natural disasters. Because weather systems are global, the effects of El Niño appear throughout all oceans, but are strongest in the Pacific.
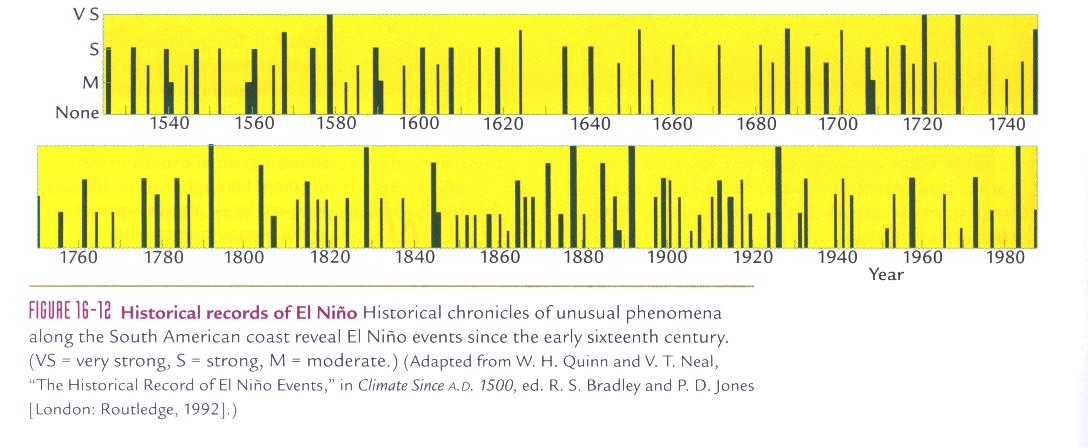
Historical records track past occurrences of El Niño. The records start in 1525 (the Spaniards began making environmental observations soon after their Inca empire conquest), and the time between successive El Niño events averages 4 years, but the actual timing varies widely. As shown in Figure 7, nine very severe events occurred in the interval of 1525 to 1980 (another very severe one occurred in 1983 and the most recent in 1998), but there's no correlation whatever with the timing of the Little Ice Age!
Humans and Greenhouse Gas Changes
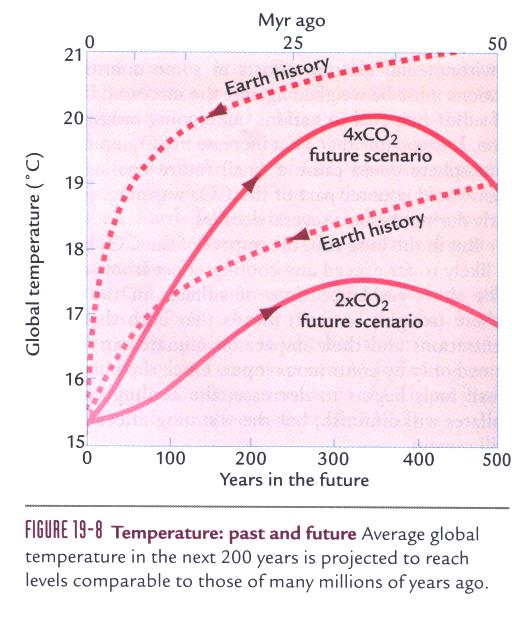
Humans arrived late in Earth's long history. The first somewhat human creatures who walked on two legs and used stone tools appeared only within the last 4 million years. Over most of their time on Earth, humans have been affected by climate but have not had any measurable impact on the climate system (In fact, there are many scientists that insist it was changes in climate that caused humans to evolve as they have. They believe that warm, wet interglacial periods allowed minor population explosions and that cool, dry glacial periods then winnowed out those less fit to survive under severe conditions). Within the last two centuries, humans have begun to alter climate (through changes to the Earth's greenhouse), first at regional and then global scales, although the magnitude of our impacts remains uncertain (that's why there are question marks at the ends of the graphs in Figure 4).
Carbon Dioxide and Methane Variation
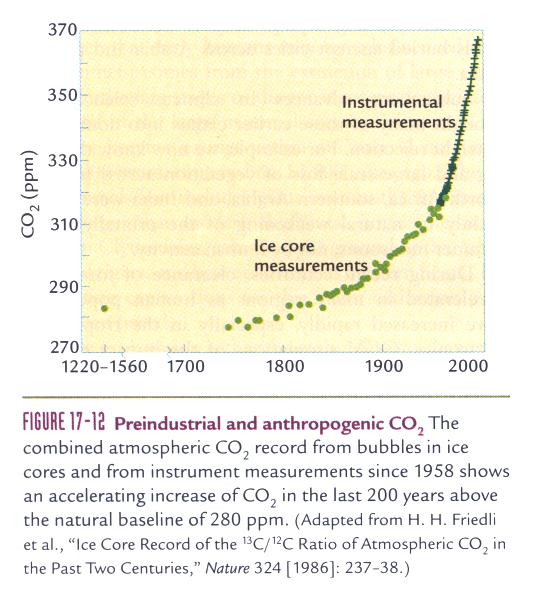
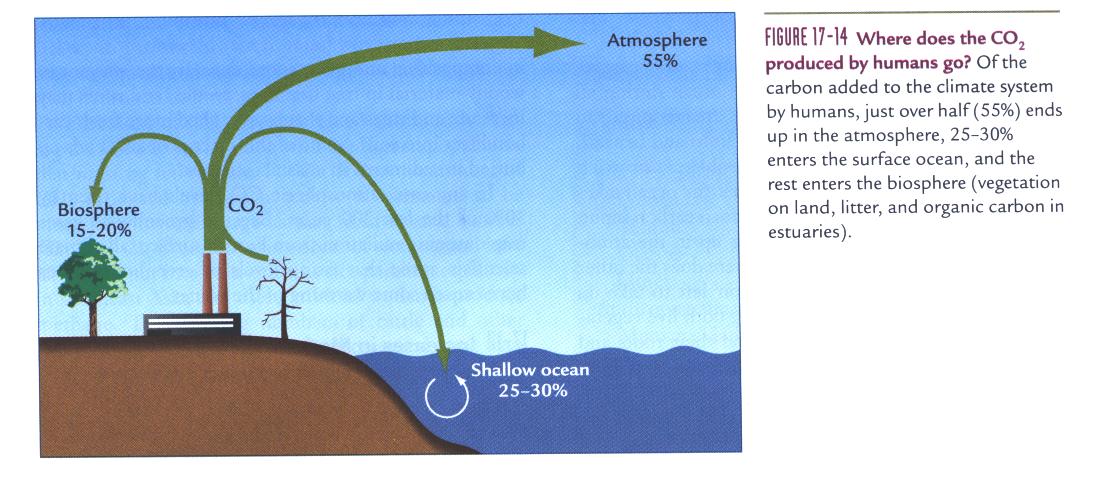
![]() We all recognize carbon dioxide as the major
greenhouse gas of our atmosphere; Figure 8 shows the
increase in CO2 since preindustrial times. We also all recognize that
the increase is largely due to human activities. Throughout the late 18th
century and most of the 19th, the main source of carbon was the clearing of
forests to meet the need for farmland, for home heating fuel and to produce
charcoal for the beginnings of the Industrial Revolution. After 1900, most of
the extra carbon has come from burning fossil fuels. Figure 9 shows
where the extra carbon goes.
We all recognize carbon dioxide as the major
greenhouse gas of our atmosphere; Figure 8 shows the
increase in CO2 since preindustrial times. We also all recognize that
the increase is largely due to human activities. Throughout the late 18th
century and most of the 19th, the main source of carbon was the clearing of
forests to meet the need for farmland, for home heating fuel and to produce
charcoal for the beginnings of the Industrial Revolution. After 1900, most of
the extra carbon has come from burning fossil fuels. Figure 9 shows
where the extra carbon goes.
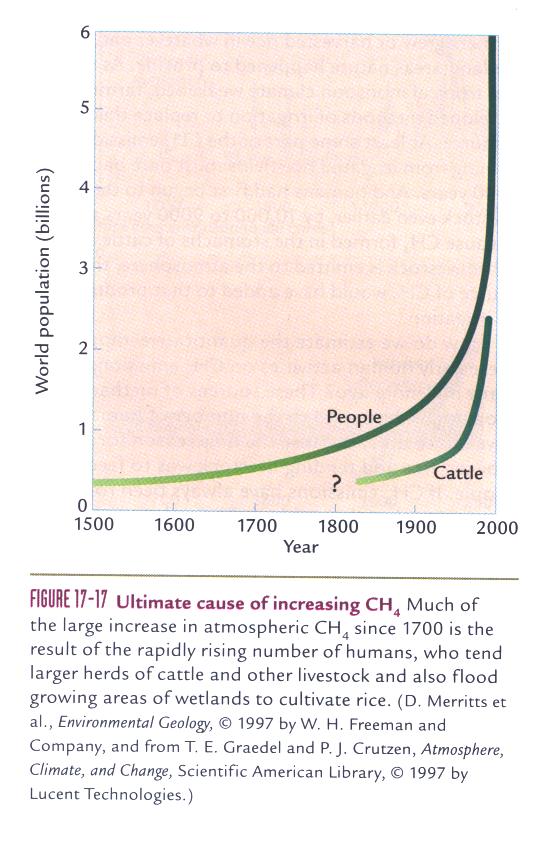
Methane (CH4) is another important greenhouse gas, and Figure 10 shows how its content has changed; most of that methane comes from our increase in artificial wetland agriculture (such as rice paddies). In the absence of oxygen (underwater), bacteria break down vegetation and extract its carbon, which combines with hydrogen to form methane. The increase from cattle simply reflects our increased need for dairy products.
Climate in the Next 100 to 1000 Years
Natural Climate Variation
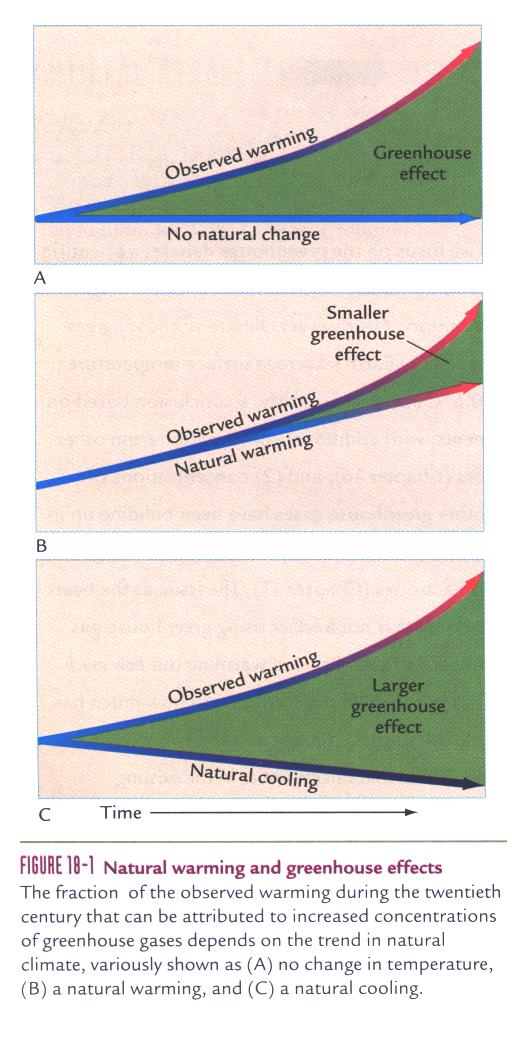
There's no doubt that global warming is real - but what are the causes? Figure 11 presents three different scenarios (all three use the same observed warming trend): the case where all warming is superimposed upon a static natural system (graph A), the case of a natural process (or combination of processes) leading to warming in addition to our greenhouse contributions, and the case of greenhouse contributions being so large as to negate a natural cooling effect.
Many scientists believe that the third graph is closest to the truth; in other words, temperature in our present interglacial period had peaked just prior to the Little Ice Age, and, except for human intervention, we would be heading back into another glacial period. They refer to this effect as a 'superinterglacial' period (Figure 12), and suggest it will all come to a crashing end soon after we consume most of the world's fossil fuels. At that point, Earth's climate will resume its cooling trend.
Projected Temperature Change
When scientists discuss potential climate changes, they constrain their models with two limiting greenhouse gas curves: the curve obtained for an atmospheric CO2-content that reaches 2 x CO2 of preindustrial times, and that which reaches 4 x CO2 levels of preindustrial times (Figure 13). Of course, atmospheric CO2 levels of either 2x or 4x the preindustrial values would be without precedent in the last several years of Earth history. We think that CO2 levels were last at the 2x level about 7 million years ago; concentrations as high as 4x preindustrial values have probably not existed since the Cretaceous greenhouse world of 100 million years ago.
Can we simply match CO2 contents with past times, thus use those past climatic conditions as analogs for future climate? Absolutely not! The future high-CO2 pulse will not stay around long enough to bring all (or even most) parts of the climate system into equilibrium. The fast-response systems will quickly adjust but the slow systems (like ice sheets) won't have enough time before most of the excess CO2 disappears into the oceans (and that will take place sometime after our fossil fuels run out). We expect the peak in CO2 to last about one century, but levels will remain above preindustrial for one thousand or more years.
The greater warmth will cause melting along the ice margins, particularly in the warmer region around southern Greenland, but the bulk of the ice will survive (By the way, high latitudes are more responsive to climate change because of the positive feedback effects of ice and snow albedo). Climate in 2100 will, in some respects, be like that 5 to 10 million years ago.
Of particular interest to Canadians is the question: what will the
Evaporation will increase worldwide because warmer temperatures will permit air to hold more water vapor. With more water vapor in the air, global average precipitation is also likely to increase, but in patterns that vary greatly from region to region. Very likely, those areas that already receive little precipitation will receive less.
There will be rapid melting of ice margins in
Some Impacts on Humans
The 15 cm rise in sea level that has accompanied the
0.6oC warming of the last 100 years should increase by a factor of
about 3 over the next century. Although a sea level rise of 50 cm sounds small,
remember that in places like
More critical than a simple rise in water level will be the devastation due to water surges that accompany hurricanes and typhoons. There is also a reasonable probability that the number of hurricanes and typhoons will increase as waters warm.
Large-scale melting of permafrost and high latitude sea ice will open the regions to increased transportation, but will devastate the populations of caribou, polar bears, and the rest of the polar ecosystem - including the cultures of northern people. The rate of high latitude species extinction will dramatically increase.
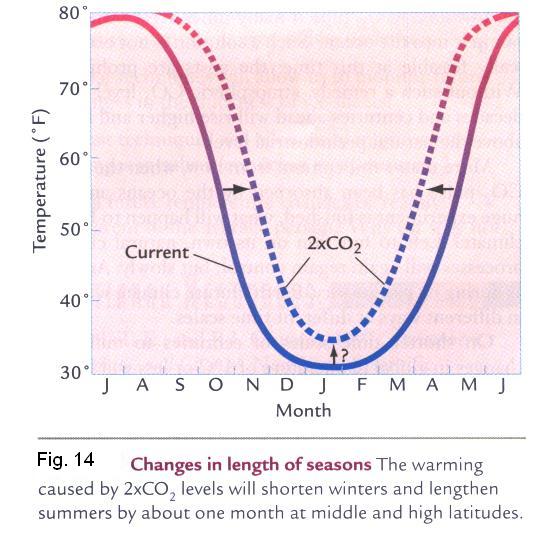
Seasons will change (Figure 14). In northern mid-latitudes (here), summers will last for an extra two months, while winters will be shorter and less harsh (this is probably not the time to invest in a local ski resort!).
Water is already a scarce and precious commodity. In regions where evaporation increases but precipitation does not, human populations will face serious water shortages. Agriculture will become more dependent upon irrigation.
Climate in the Far Future
More than a millennium from now, when the excess CO2 has been absorbed by the oceans and this huge experiment is finished, what will happen to Earth's climate? Left to function on its own, natural climatic processes will again regain control, but slowly. And just as during its past history, Earth's future climate will vary in different ways at different time scales.
On shorter time scales of centuries to millennia, changes in global temperatures of 1oC or less will be driven by changes in the strength of the Sun and by whatever other processes cause millennial scale oscillations. Over thousands to tens of thousands of years, the probability is that a cooling of climate at high northern latitudes will gradually initiate the next glacial period. As noted before, the expansion of ice in the Little Ice Age is thought to have been the first step toward the next glaciation, but it was ended by the human effect of strengthening the greenhouse gases. Without those gas additions, the process will resume. Over still longer tectonic time scales (millions to tens of millions of years), Earth's climate will probably continue to drift toward colder temperatures and more intense glaciations. The relatively pleasant climatic interlude of the last several thousand years will certainly end.
Appendix: The
This is the best environmental study that has yet
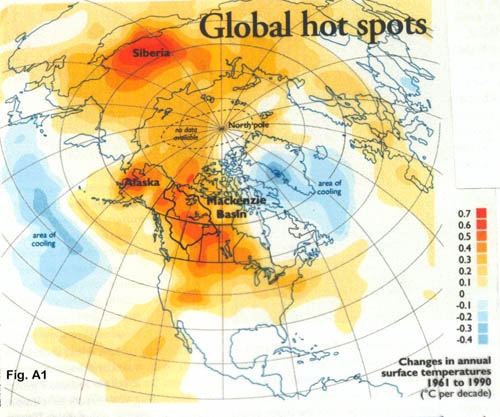
been done in the world as the superinterglacial begins. Three northern regions
around the world have been termed "climate hot spots":
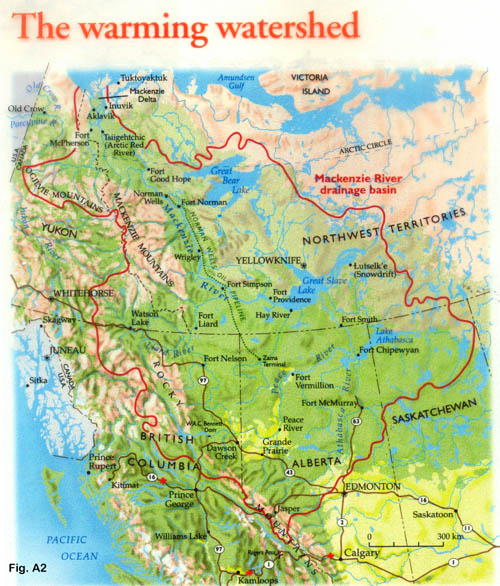
The Mackenzie Basin Impact Study (MBIS) focuses on the 1.8- million square-kilometer drainage basin of the continent's largest northerly flowing river. The six-year, $950,000 effort documents rising temperatures, melted permafrost, new landslides, and increased forest fires. Then, using computer technology available, its authors project the future impact of continued global warming on the area's wildlife, vegetation and human inhabitants.
The 4,241-kilometre-long Mackenzie River draws its
waters from as far south as the Alberta Rockies near Jasper (Figure A2). It is
fed by the
These ecosystems have undergone significant changes. Over the last 35 years,
there's been a substantial increase in temperatures - about a degree a
decade - in the center of the basin. There has been glacial retreat,
landslides, and a lowering of water levels, and the southern edge of
permafrost in the
Supported by, among others, the federal government, the