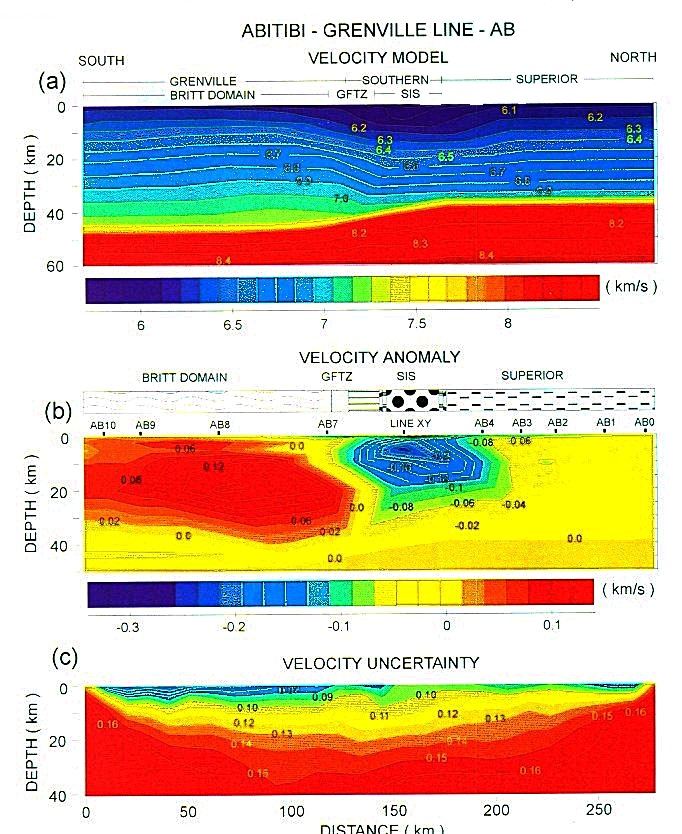
Analysis of the refraction data indicates that the P-wave and S-wave velocities vary linearly from 6.13 km/s at the surface to 7.1 km/s and 3.56 km/s to 4.11 km/s, respectively, at a depth of 40 km (cf. 6-7 km/s and 3.5-4 km/s in Anderson, D.L., Theory of the Earth, p. 48). The arrival times of waves passing through the Grenville Province are earlier than those of waves passing through the Superior Province, indicating that the Grenville crust has a higher average density than the Superior crust. The Moho underneath the Superior Province is also generally transparent compared to the Moho beneath the Grenville where it tends to be strong reflector. The crust also seems to thicken beneath the Grenville Central Gneiss Belt along line A-B (as would be predicted by the Durrheim and Mooney model), and to buckle upwards underneath the Grenville Front Tectonic zone along line MG.
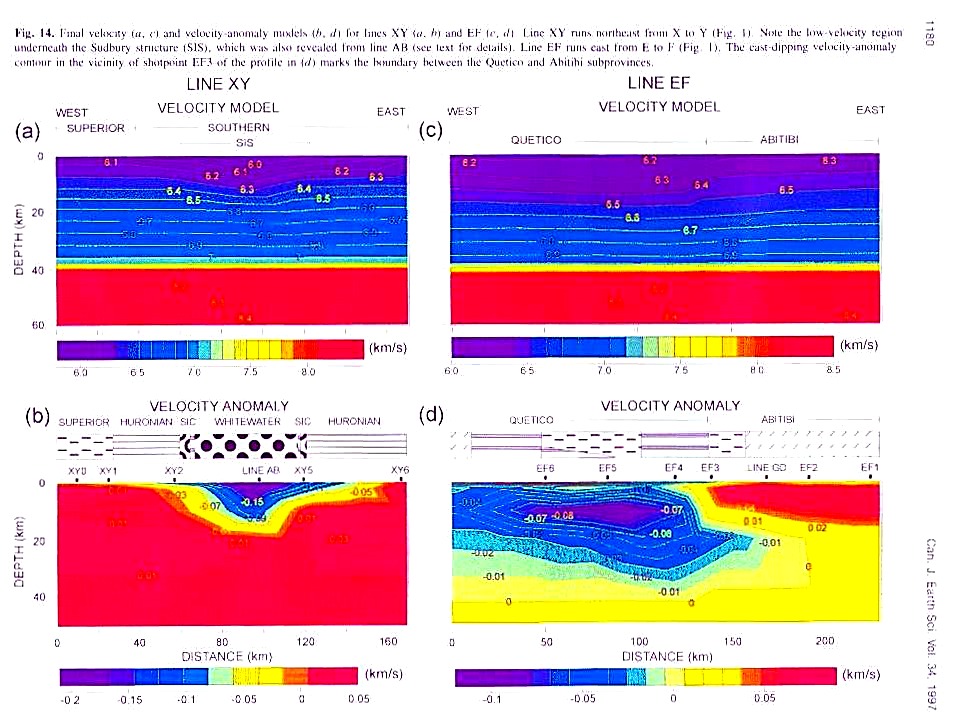
Interpretation of the seismic data involves the development of an average velocity model, a velocity model, and a velocity anomaly model. The average velocity model depicts the velocity distribution in standard crust based on the assumption that the velocity gradient varies linearly with depth from 6.13 km/s to 7.1 km/s. The velocity model illustrates the actual estimated velocity at each point in the crust, whereas the velocity anomaly model is created by simply subtracting the average crustal velocity field from that of the velocity model. It therefore represents the deviation from the expected value predicted by the average velocity model. However, be careful to note that a negative velocity anomaly value for a lower crustal segment merely implies that the segment has a lower velocity value than expected at that level in the crust, and not that it has a low velocity relative to the near surface layers.
The variation in velocity can be attributed to rock permeability (at shallow depths only), rock fabric (preferred orientation of minerals or difference in grain size), change in the ratio of mafic (cpx) to felsic (plag) minerals or anhydrous (px) to hydrous (amph) minerals, or change in the proportion of garnet (favoured by increased iron content, higher pressures, and dehydration), etc.
In the case of the east-west Abitibi line EF (click), variation in the velocity model is most apparent in the upper crust (<20 km) with the development of a west verging pseudo-fold. The velocity anomaly model shows that this variation can be attributed to the presence of a relatively dense 15 kilometre thick plate of ultramafic-mafic (komatiitic?) rocks beneath the Abitibi, and a plate of low velocity rocks beneath the Quetico belt that are underthrusting rocks of the Abitibi belt. It also shows that the crust beneath the Quetico is characterised by generally low velocities compared to average crust.
On the North-South Abitibi - Grenville line MG, the velocity structure is perturbed by a set of orthogonal pseudo-folds, a positive pseudo-structure beneath the Central Grenville and a complementary negative pseudo-structure beneath the Pontiac belt south of the Abitibi greenstone complex. The velocity anomaly model shows an important horizontal velocity anomaly gradient from South to North, from an upper crustal positive anomaly in the Grenville to a lower crustal negative anomaly in the Abitibi. The anomalies are separated by a distinctive high level negative anomaly beneath the northern part of the Grenville Front. The anomaly structure could be attributed to southerly underthrusting of garnet-rich Grenvillian crust by plagioclase-rich Archean lower crust, and subsequent or pene-contemporaneous 'diapiric' northerly thrusting of both units over the Pontiac-Abitibi. Decrease in velocities beneath the Grenville Front Tectonic zone might also be attributed to phyllonitization of feldspathic rocks during the Grenville orogeny. On the other hand the negative anomaly may be the same as the marked negative anomaly beneath the Sudbury region seen on lines AB and XY, and therefore has no simple interpretation.
The break in the high velocity structure at station 14 on line MG is taken to represent the Paleozoic Ottawa Valley rift, and a similar break at stations 8-9 could represent a similar Archean age rift beneath the Pontiac sedimentary basin.
The Central metasedimentary belt of the Grenville is marked by a relatively near surface positive anomaly whereas the Central Gneiss Belt to the north has a marked positive anomaly at greater depth, the geometry of the separation perhaps suggesting overthrusting from south to north.
Both the North-South A-B and East-West X-Y lines passing through the Sudbury delineate a distinctive negative velocity anomaly beneath the Sudbury (impact) basin. The Sudbury Intrusive complex does not show as a positive anomaly relative to the rocks it overlies. Interestingly, the anomaly pattern at the Grenville Front could be interpreted to indicate low angle south to north overthrusting at high levels, but overall underthrusting of the Grenville beneath the Southern Province at depth. Geological relationships indicate that the high level thrusting could not be Grenville in age.
The interpretation of refraction seismic models is highly speculative, and provides only a very rough guide to the gross structure of the Precambrian crust of Ontario.
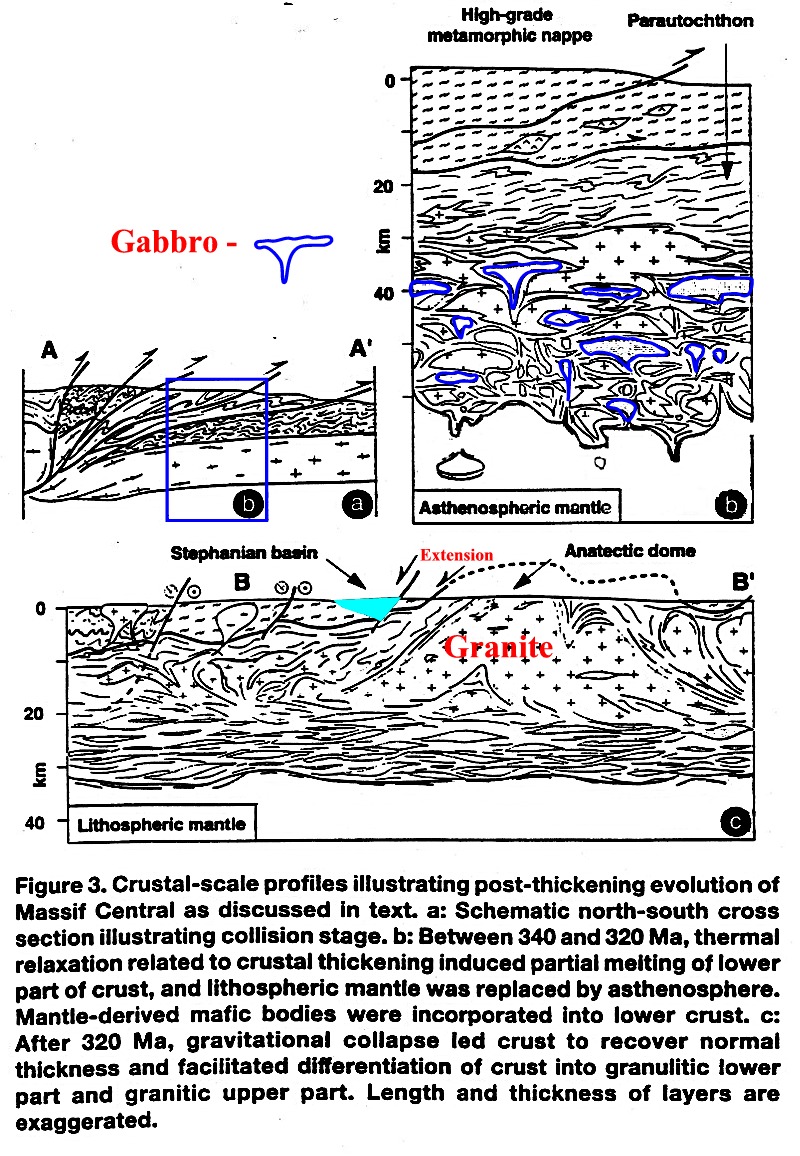
Recent models (e.g. Costa and Rey, 1995) of continental crust that have suffered the effects of collisional accretion such as the Himalayas, the Variscan of Europe, and the Grenville of North America invoke:
1) a stage of crustal thickening related to collisional thrusting;
2) a second stage (20 Ma) of thermal relaxation involving replacement of the lithosphere by the asthenosphere, underplating of the crust by mafic magma, and partial melting of the lower crust;
3) a third stage of gravitational collapse of the thickened and heated crust that facilitated differentation of the crust into an attenuated granulitic lower part with a flattened anastomosing fabric and a granitic upper part that is structurally heterogeneous.
Seismic reflection models (e.g. southern Grenville Lithoprobe data, B. Roy, 1998) display reflector patterns that are commensurate with this model.
Structural Provinces of North America.
Location of seismic lines, Winhardi and Mereu, 1997.
Line A-B, Winhardi and Mereu, 1997.
Line M-G, Winhardi and Mereu, 1997.
Lines X-Y and E-F, Winhardi and Mereu, 1997.
RETURN TO:
Click here to return to beginning.