 POINTS,
LINES, POLYLINES, POLYGONS,& TEXT
POINTS,
LINES, POLYLINES, POLYGONS,& TEXT
Click here to return to course outline.
Earth Science 505 - Vector and Raster images
LAST REVISED Dec 2nd 2001; files: c:\aacrse\505\htm\vecras.htm; c:\aacrse\300\htm\vecras.htm;
Network Neighbourhood/Earthnt/public/300/vecras.htm;
http://publish.uwo.ca/~wrchurch/300/vecras.htm.
Sample files
in c:\aacrse\505\idr\useattr\
Vector Images
The storage of information in a database
The
information in a relational database is stored in a set of 'cells',
each of which is identified by its row and column position in an orthogonal
grid. Each row of cells constitutes an individual record, whereas each
column (known as a field) in the grid,
represents a specific type of information. Usually field 1 would
contain a unique value that identifies the row , and the 2nd and 3rd fields
the X and Y coordinate values. For example, the cell at row 14 column 1
would likely contain the value '14', the outcrop number, whereas the cell
at row 14, column 4 may contain either a numeric value or a name representing
the rock type present at the outcrop.
Imagine
that you have visited an outcrop in the field, that you know its location
on a coordinate grid (e.g. x=20, y = 45), and that at this site you have
identified the rock type, measured the magnetic intensity, and determined
the degree of weathering of the rock. If this information is to be recorded
in a database or spreadsheet, the database
would need to contain the following fields (columns):
a geographic identifier for the outcrop (e.g. a numerical value - 1,2,3,...);
x-coordinate position of the outcrop;
y-coordinate position of the outcrop;
a rock type identifier (e.g. a numerical value of 1 for granite, 2 for
diabase, etc.);
the magnetic intensity, as measured by the magnetometer;
a value representing the degree of weathering measured on a scale of, say,
0 to 10.
The geographic identifier, rock type identifier, magnetic intensity, etc, are known as the ATTRIBUTES of the point location. Other attributes might be elevation, the strike orientation of bedding and/or foliation, the angle of dip of the bedding/foliation, the gravity value, chemical composition of the rock after laboratory analysis of a sample taken from the site, etc.
To aid in the visual inspection of maps on which are plotted attribute values, for example a map showing the variation in the degree of weathering, each attribute value may be assigned a specific colour and/or symbol, selected from a PALETTE, where a palette is simply a table relating a set of attribute numbers, or range of numbers, to a set of arbitrarily selected colours. An example of a colour palette file might be:
1 red (the value
1 represents the colour red)
2 green
3 cyan, etc.
or
1 cyan
2 red
3 magenta, etc.
If we generate a coordinate data file with the following structure:
X-Coordinate:
x1, Y-Coordinate: y1, Geographic Identifier: 1
X-Coordinate:
x2, Y-Coordinate: y2, Geographic Identifier: 2
X-Coordinate:
x3, Y-Coordinate: y3, Geographic Identifier: 3
the information contained in this file would allow us to draw a map showing a set of point symbols, each symbol coloured according to the value of its geographic identifer and the colour that corresponds to that value in some selected colour palette. Such a map would not be very useful however, because it would merely show a set of points each of a different colour.
On the other hand, if we generate an attribute values file containing the following fields:
Geographic Identifer:
1, Rock Type 1
Geographic Identifer:
2, Rock Type 2
Geographic Identifer:
3, Rock Type 3
Geographic Identifer:
3, Rock Type 2
Geographic Identifer:
3, Rock Type 1, etc
the computer software can use this information to substitute the Rock Type attribute value for the Geographic Identifer value in the coordinate data file, such that now the locations plotted by the computer would assume a colour corresponding to the Rock Type value, and the colour would permit visual inspection of the distribution of the various rock types found within the map area. If we were to create a gravity values file, the colours would change to reflect the gravity value attached to the coordinate location. In this way we can generate a rock type map, a magnetic values map, and a degree of weathering map. These maps constitute a map layer set, and are all POINT VECTOR maps.
The following explanation of value files is taken from the IDRISI HELP file:
Values files contain tabular data about map features. They
are most often associated with vector layers,
but can also be linked to image layers.
(The distinction between vector and image (raster) layers will be explained
below). In the case of vector layers, the vector
data file primarily contains information on the geographic definition
of features (i.e., their location and shape). The only attribute that is
stored is a numeric identifier. It is possible to use this identifier to
refer to a feature characteristic (e.g., all lines with an identifier of
3 represent major roads). However, it is also possible to give each feature
a unique identifier, and then to associate those identifiers with rows
of data in a data table. In this case, each column of the table can contain
a different attribute about that feature. Each row in such a table is known
as a record, while each column is called a field. With such a logic, each
feature in the vector file is linked to a record in the data table by means
of its identifier. To do so, the data table needs to contain an identifier
field (usually the first field). Other fields then contain information
about those features (e.g., population, predominant land use, elevation,
etc.).
Unlike vector layers, image (i.e raster) layers
are not usually associated with values
files (since the data contained in the cells of an image represent attribute
data to start with). However, it is possible to adopt an identical logic
to that stated above. In this case, we assign to each cell a numeric value
which acts as an identifier of the feature to which it belongs. Thus, for
example, all of the cells in district 6 might be assigned a 6. An image
of this type is referred to as an index image.
It can then be associated with a values file in exactly the same manner
as a vector layer. IDRISI for Windows supports a variety of formats for
values files, from simple 2 column ASCII files (containing only an identifier
field and a single attribute), to multi-field tables in commonly used database
formats (such as ACCESS, dBASE and FoxPro). In addition, to facilitate
the maintenances and analysis of such tables, IDRISI for Windows provides
a database management facility known as DATABASE WORKSHOP. It is
important to reiterate here that image layers are
rarely associated with values files, but can be, and that vector
files are often associated with values files, but don't have to be. Many
users make extensive use of a raster GIS such as IDRISI for Windows, and
never use such a feature. However, they can be useful in cases where a
great deal of information is being recorded about the same set of features.
Drawing elements/objects
In order to draw a straight line as a vector object, we would need to know the coordinate position of the beginning and of the end of the line. These positions are called the nodes of the line. If the lines are not straight they are called polylines or arcs, and the change in orientation of the line segments constituting the arc are defined by point locations known as vertices. Different kinds of lines, for example, faults of various type or age, can be given attribute values such that they would be plotted on the map in separate colours.
POINTS,
LINES, POLYLINES, POLYGONS,& TEXT
Vector drawing elements/objects - click to see enlarged version of the above diagram.
Polygons are polyline objects whose beginning and end nodes occupy the same coordinate position. They may be closed or unclosed. As in the case of lines, polygons representing different rock units can be displayed in a colour defined by an attribute value. Points, Lines, Polylines, Polygons (areas), and Text are the principle drawing objects used to construct vector images.
What do IDRISI Vector image files look like?
The following is a file of three line values.
1 2
'1' is the object identifier; '2' is the number of nodes and vertices (2
= a straight line)
0 0
'0 0' is the X and Y coordinate value of the beginning node
of line 1
20
20
'20 20' is the X and Y coordinate value of the end node of line 1
2 2
'2' is the object identifier; '2' is the number of nodes and vertices (2
= a straight line)
75
75
'75 75' is the X and Y coordinate value of the beginning node of line 2
100 100
'100 100' is the X and Y coordinate value of the end node of line 2
3 2
line 3, etc
25
25
60 40
0 0
The final 0 0 is an end of file marker.
The following
is also a line file. What does it indicate?
2 2
0 0
20 20
2 2
75
75
100 100
2 2
25
25
60 40
0 0
What would a file to draw three triangles look like?
The following is an attribute values file relating the outcrop geographic identifier in the first column to the fault type value (e.g. 5 = normal; 6 = reverse; 7 = wrench) in the second column:
1
5
2
6
3
7
ARCINFOalso stores the coordinate and attribute data in separate files. For example:
LOCATION
FILE
1
34.98 82.86
27.70 78.06
25.92 74.78
END
2
51.18 47.68
53.87 53.45
57.28 74.51
50.77 78.84
40.09 83.02
34.98 82.86
END
3
62.69
81.47
68.58 86.89
83.75 87.20
87.46 77.45
83.28 69.86
67.80 66.77
64.71 72.03
62.38 77.29
62.69
81.47
END
ATTRIBUTE FILE
1,
1, 0, 0
2,
2, 0, 0
3,
4, 0, 0
The first parameter in the Location and Attribute files links the coordinate data of each drawing object (entity) to the attribute represented by the second parameter in the Attribute file. In the above Attribute file, the first attribute value of 1 might identify entity '1' as a solid line, whereas the second attribute value 2 might indicate that entity '2' is a dashed line, and the attribute 4' might identify the entity as a barbed line.
Raster Images
In
raster
images, points are not located according to their geographic coordinate
values, but according to their position in a continuous list (column) of
sequential values representing cells read from left to right (columns)
and top to bottom (rows) in an orthogonal grid of attribute values.
If we know the
map grid is, for example, 4 rows by 5 columns, the image file can be set
up as a single list of 25 numerical values, with each number representing
the attribute value of the cell corresponding to the intersection of
the specified row and column. For example, in the case of a data file composed
of the following 25 attribute values:
100
145
23
178
1
44
etc, to:
267
where 100 is the attribute value of cell row 1 column 1; 145 is the attribute
value of cell row 1 column 2, etc, to 267 the value of cell row 5 column
5, the corresponding raster image would look like:

There should
be no need to specify the coordinate location of the points. All we really
need to know is the number of columns in the image, since the total number
of cells divided by the number of columns gives us the number of rows.
(Nevertheless, it should be noted that Idrisi requires that you specify
both the number of rows and columns.)
The actual dimensions
of the cells in the image depends on the number of columns and the size
(metres, kilometres, degrees) of the image in the x-direction. If an image
has 100 columns and its size in the x-direction is 100 kilometers, the
resolution of each cell is 1 kilometer;
if the size in the x-direction is 1 meter, the resolution is 1 cm. Either
the size or the resolution can be specified as arbitrary values. You will
note that if an image is composed of isolated points or lines, most of
the cells in the image will have no attribute, and will consequently be
assigned a background value of 0. The colour corresponding to 0 depends
on the palette used to display the image. A line would be represented as
a locus of contiguous (horizontal, vertical, or diagonal) cells all with
the same attribute value; and if there is only one line on the map, all
the surrounding cells within the orthogonal matrix would have a value of
0.
Procedure:
The following exercise has no special geological significance. It has been devised to introduce the essential concepts of GIS, and the mechanics of preparing vector and raster images using the IDRISI software.
A) Making
a Vector Image
NOTE: 1) IN IDIRISI,
WHEN IT IS NECESSARY TO ENTER A FILE NAME, DOUBLE
CLICK THE NAME ENTRY BOX TO RETRIEVE THE PICK FILE MENU, AND DOUBLE
CLICK THE REQUIRED FILE NAME (or click the name and click OK)
DO
NOT TYPE IN THE FILE NAME; 2) .IN IDRISI, OTHER
THAN IN THE CASE OF EDIT IN Data Entry, WHEN YOU ENTER THE NAME
OF A FILE, OR SAVE A FILE, DO NOT
TYPE IN THE FILE EXTENSION.
1) Go to your folder in users on Earthnt (H:), where H is the name of the mapped drive Earthnt\Users on your computer (it may be some other letter other than H), and make a folder named your initials1; KEEP READING - (do not include the quotes, and your initials really means your initials; e.g. wrc1). If you have not previously used the computers in room 17 and are baffled by this instruction, do not get excited, stay cool and politely request the help of the instructor.
IF YOU HAVE NOT COMPLETED INSTRUCTION 1 OR HAVE NOT UNDERSTOOD INSTRUCTION 1, DO NOT PROCEED TO INSTRUCTION 2.
2) Load IDRISI
(via Start and Programs).
Once
IDIRISI is loaded and occupies the screen, you can get back to your desktop
(or WEBCT site if you are addessing this file via WEBCT) by using
the 'ALT-TAB Window TOGGLE' - hold the TAB key down with your thumb and
click the TAB key to bring up the 'WINDOW TOGGLE' window. IF you have several
windows open, click the TAB key while still holding down the ALT key until
the desired window is defined by the selection box. Alternatively, you
can reduce the size of both the IDRISI (and WEBCT) windows so that they
are both partially visible.
Set the IDRISI
Environment to the folder you have just created by clicking (press the
left mouse button) Environment
on the Idrisi
menu bar and then the ENVIRON tab in
the drop-down selection menu.

The above ENVIRON window will appear. Select the drive (e.g. Earthnt (H:)) in the Drive selection box, and the directory (your name/yourintials1) path to your folder. Set the default reference units to metres. The Path of Working Data Directory box should show something like "h:\wrchurch\wrc1". If it doesnt, get help from the instructor. If you are not sure that what you are doing is correct, get help.
3) As illustrated in the following window, click Data Entry on the IDRISI menu bar, and then Edit. On the Edit menu: click the Other file in data directory button, and in the File name: box enter the name yourinitialstst1.vec. (USE ONLY TWO INITIALS, and add .vec the file extension for this kind of file to the file name. ) Click theOK button.

Type in the code for a line entity file as follows:
1 2
(this should be typed as: 1 space 2, not 12)
0 0
20 20
2 2
75 75
100 100
3 2
25 25
60 40
0 0
Click Save; click Exit.
4) Follow the same procedure to make an attribute values file named yourinitialstst1.val (note the file extension for this kind of file is .val), e.g.
1 5
2 6
3 7
5) For each vector
or attribute file it is necessary to create
an accompanying DOCUMENT file in which are
reported the values to be ascribed to various parameters, e.g. for the
vector file wrctst1.vec there must exist a
document file wrctst1.dvc, for the attribute
values file there must exist a DOCUMENT file wrctst1.dvl.
From the IDRISI
menu bar select File-Document
to make a vector document file for yourinitialstst1.vec:
click File, click Document,
click the Vector file button, double click
the File to document file name entry box,
double click yourfilenametst1 in the Pick
file list, and then the OK button.
The following DOCUMENT window will appear.
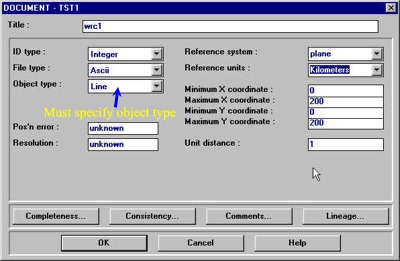
In the
Document
data
entry box, enter:
Integeras
ID type,
Ascii
as file type,
Line
as Object type, (different kinds of drawing object points, lines,
polygons - must occupy their own image plane),
plane
as Reference system,
meters
as Reference units,
the MIN-MAX
values as 0 and 100,
and unit
distance as 1, in the relevant boxes. Enter your name in the
Title
box.
Try to think what each of these parameters means it is useful to make a rough drawing of the template When you click the OK button, the file will appear in your directory as the file yourinitialstst1.dvc.
6) Also make
a Document file for the Attribute values file, setting:
Records
to the number of rows (3) in the attribute
file,
Fields
to 2 (the maximum allowed in this version of IDRISI),
the Min. value
to 5 and the Max. value to 7,
set Value Units
to m, Field 0 to identifiers, Field 1 to Attribute,
and data type
to Integer.
Enter your name
in the Title box.
Again make a rough drawing of the template. When you click the OK
button, the file will be saved as yourinitialstst1.dvl.
7) Display the vector image by clicking Display on the IDRISI menu bar, followed by Display Launcher. The following DISPLAY Window will appear.

Click the Vector file button, double click the File to display box to select the vector file 'your inititalstst1', select the Qualitative 16 symbol palette option. Click OK to display the three lines you have defined in your 'yourinitialstst1.vec vector image file.
Repeat this operation
but this time click the Connect to values file option and select the
attribute values file 'yourinitialstst1'.
The second image
will be superimposed on the first. Click and drag the dark blue Tool Bar
at the top of the image to reveal the first image.
8) In Display-Symbol Workshop open the qual16.sm1 symbol palette (click in sequence Display, Symbol Workshop, File, Open, and the Line button; double click the File name box, select qual16, and examine the nature of the pallette that should now be displayed. Explain to yourself why the lines in the two vector images have the colours they have.
9) Select Display- Palette Workshop from the IDRISI menu bar and get the qual16.smp palette file by sequentially clicking, as shown in the Window below, File, Open, and then the Retrieve file from permanent library button in the Open window. Double click the File to open box, and select qual16. The Palette Workshop window should appear.
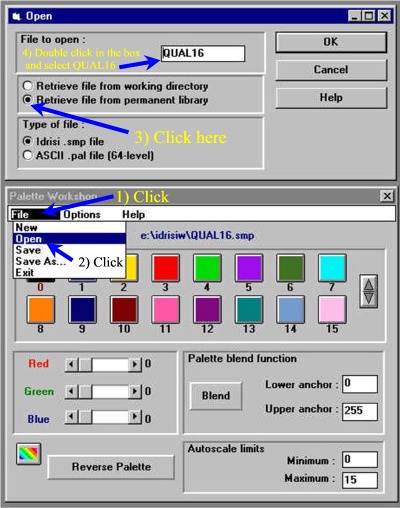
The zero
value below the first black tile will be coloured red.
Click
the tile to deselect it.
Save the palette
to your working directory
in your disk area as qual16md. (Click
in sequence the File, Save As, and the Save
file in working directory buttons. Type the file name
qual16md
into the Save file as box, and click OK.
When
entering the file name do not add the .smp extension, IDRISI will do this
for you). Now click the black tile, the '0'
value
will turn red indicating that it is selected. Make the 0
tile white by setting the RED,
GREEN,
and BLUE values to 255
(drag the sliding buttons to the extreme right) - if you dont understand
this, ask the instructor.
Click the now
white tile (the 0 value will become black
instead of red, meaning it has been deselected), and Save
the now modified file - and even although you have
already saved it! Exit the palette
window.
Re-examine the palette display to
make sure that the change from black to white of the 0
tile has been registered - sometimes the new file is saved but the 0 tile
remains black ; we do not know why!! In this case, make the change once
again, turn off the '0' tile, and 'Save'
the file. Leave the palette menu displayed to the right of the screen.
(You will use this palette in the display of the
raster image you will next create.)
B)Making a Raster Image
1) Click Data Entry on the IDRISI menu bar, and then Edit. On the Edit menu: click the Other file in data directory button; and in the File name: box enter the file name rast.img. In the IDRISI text editor, type a single column of 25 integer values in in any order but with the values being between 0 and 15. Save the file as rast.img to your directory. (NOTEthat the extension for this kind of file is .img, and because it is an 'Other file' the extension must be typed in as part of the file name.)
2) Use File-Document
to make a document file for rast.img file;
(click File on the IDRISI
menu bar, Document, the Image file
button; double click the File to documentbox,
select the file rast in the Pick
File window, and click OK. In the
Document window enter:
the Columns
and Rows as 5 x 5,
Min-Max
X and Y coordinates as 0 and 5 (i.e. a resolution of 1),
Unit distance as 1,
Reference system as plane,
Reference
units as meters,
Data
type as Integer,
File type as Ascii,
and the
Minimum
value and Maximum value as 0 and 15 respectively.
Make a summary drawing of the menu template and try to think of the significance of each of these parameters. (NOTE that the extension for this kind of file is .doc.). Click OK to terminate
3) Display the image in Display-Display Launcher, clicking the Image file button, and selecting the user defined qual16md.smd palette. If you get a message asking whether Idrisi should convert the ascii file you have just created to a binary file, reply YES.
4) You should now have an image composed of a 5 x 5 matrix of coloured squares (cells). Click the toobar icon with a ?. The cursor symbol will change to a plus (+) symbol. Click one of the cells. The attribute value of the cell will be displayed as z: attribute value in the rightmost box in the display bar at the bottom of the screen. Because you have displayed the image with the qual16md.smd palette, cells with a value of 0 will appear white rather than black.
C)Converting a Vector image to a Raster image
1)
First
create a raster image template corresponding to the vector image you wish
to convert.
In the Idrisi
Data
Entry menu select Initial, and
click the
Define spatatial parameters individually
button. Enter an output image name yourinitialststi
(i for initial). The integer, and binary
buttons should also be selected, and the default value in the initial
value box should be left as 0. Click
the Continue button and in the next menu
enter the Number of rows and Number
of columns as 512, the Min
and Max X and Y coordinate values as
0,100,
and the value units as 1.
Click the OK button.
2) The following step is not entirely necessary, but would be carried out where it is required to create raster images from several different vector images with the same spatial parameters but different drawing objects, e.g. points, lines and polygons (each of which must occupy their own image plane). Rather than creating a new initial image each time as in step 1), it is easier to copy the intial raster image.
Using the IDRISI COPY function in File-File maintenance, copy the image file yourinitialststi.img to a file named yourinitialststa.img by clicking File-File maintenance, then Image in Select file type:. Click the file yourinitialststi.img and then the Copy button. In the name window that should appear, enter the name of the file to create - yourinitialststa (do not add the extension .img). The corresponding document file yourinitialststi.doc will be copied automatically by Idrisi to a yourinitialststa.doc file. If the file name yourinitialststi does not appear in the Select file from this list box, it means you have not successfully created a corresponding .DOC file.
3) Edit the DOCUMENT file for the image yourinitialststa (click File, Document, and the Image file button. Double click the File to document box, and select the file yourinitialststa in the Pick File window. Change the Minimum and Maximum attribute values (NOT the Minimum and Maximum X and Y coordinate values) from 0 and 0 to 0 and 3, respectively. (Think about why you are providing this information.) The other parameters do not need to be changed.
4) In the Reformat menu, select, Raster/Vector Conversion and LINERAS, and convert the vector image yourinitialstst1.vec to yourinitialststa.img.
5) ONLY if you have not already done so (instruction A-9, above), in Display -> Palette Workshops get the qual16.smp palette file, make tile 0 white instead of black, and save as qual16md.smp.
6) Display the image (Display inDisplay Launcher) using qual16md as the palette. Sometimes lines drawn in yellow do not appear on the new image, this is a hardware or server problem peculiar to the computers in room 17. In this case, re-display the image, but this time set the expansion factor (option below the Name of File to Display box) to a higher value (less negative) than is shown.
7) Overlay the raster image with the corresponding vector image using Add Layer... in the Composer window (usually displayed on the right side of the screen) - if this window is not evident, check with the instructor. (NOTE: vector layers can be layered one on another; the last layer added is the top layer.)
8) Examine the difference between the vector and raster lines by magnifying a section of one of the lines. (Use the Window display (Blue outlined 'rectangle' icon uses a click-and-drag rectangular marquee to outline the area to be magnified; you can reverse the zoom by making the drawing active, clicking the 'rectangle' icon, and then clicking with right hand mouse button.)
D) Changing the attribute values of the displayed raster objects
The attribute values of objects in a vector image can be interactively selected in the Display menu by choosing a values file to connect to. Furthermore, once a vector image is displayed, its attribute value and its associated palette file can also be changed from the Layer Properties menu (Click the Poperties bar in the Composer window, click Use values file, etc.). However, the attribute values of point and line image files cannot be changed interactively in this way; a new file has to be generated using the Assign module. (NOTE: the attribute values of polygon images can however be changed from the Layer Properties menu, and in all cases the palette file can be changed by selecting a new palette file in the Palette File box of the Properties menu.)
1) Run Data Entry-Assign to enter yourinitialststa.img as the name of the image file (Feature Definition Image box); yourinitialstst1.val' as the name of the attribute values file, andyourinialststamd.img as the name of the new image.
HOMEWORK
Delete all the
files and repeat sections A, C, and D, re-writing
the yourinitialstst1.vec file for a polygon
image containing three triangles (remember, there are four points in a
triangle, with the first and last points having
the same coordinates). (You can use the same values file, and overprint
the same raster image files yourinitialststa.img
and yourinialststamd.img when carrying out
the instructions in sections
C) and D)
- however this may create some confusion and is not recommended!)
Print out the yourinialststamd.img polygon image using the print function in the COMPOSER window, sign it, and hand it in to the instructor.
SUMMARY:
Now you understand the fundamental aspects of vector and raster images,
the relationship between the geographic identifier, other attribute values,
and the palette file. You can change the attribute values of vector objects
using an attribute values file, convert a vector image to a raster image
and overlay it with the vector image, and change the attribute values of
the raster image.
IF YOU FIND
TYPOS, AMBIGUITIES, OR INCONSISTENCIES IN THESE NOTES, PLEASE BRING THEM
TO THE ATTENTION OF THE INSTRUCTOR. SUGGESTIONS FOR IMPROVEMENT WILL BE
GRATEFULLY RECEIVED.
IF YOU NEED PARTICULAR
HELP WITH THIS EXERCISE, PLEASE MAKE AN APPOINTMENT WITH THE INSTRUCTOR
(email wrchurch@uwo.ca)
FOR SOME TIME TO BE SPENT WITH YOU ON MONDAY, THURSDAY OR FRIDAY.
FIGURES
Vector drawing elements/objects.
RETURN TO: