A. Every map produced for this course must be drawn in a rectangle 16.5 cm by 23 cm (6.5 by 9 inches, allowing margins 1 inch wide on a standard 8.5 by 11 inch sheet of paper), neither smaller nor larger and centred on the page. The rectangle may be in landscape or portrait orientation. A box of this size, the 'neatline', using the thinnest line available, must surround everything on the map including your name. Other boxes may be used to contain data within the map. All should use the smallest line thickness available, and none should touch or overlap.
B. No text anywhere on the map should be underlined or in any decorative font (outline, shadowed, etc.), or have a size smaller than 8 point.
C. Identify yourself only by name, not by your student number or computer user name. Do not include the date you completed or handed in the map. Only the date of the information portrayed on the map or its source (if applicable) should appear on the map.
Map Design:
Design is necessarily a subjective issue, and maps will be assessed with this in mind. Nevertheless, certain concepts of good functional design should be followed. Keep in mind the following points:
a) All text must be legible, complete, unambiguous and spelled correctly.
b) Avoid large blank areas and aim for approximate symmetry if feasible.
c) Devise a logical relationship between text, lines or shading and the things they represent (e.g. larger text, heavier lines, darker shading for more significant items on the map, similar symbols or patterns for similar items and different ones for different items).
d) Nothing is fixed in our software: if your map is crowded, shrink something to fit better. If there are large empty spaces, move or enlarge something to fill the space available. Try different fonts, sizes or wording to make text fit. Rotate or move objects until the results are most pleasing.
e) Seek a second opinion. Ask a friend if your design looks balanced, or if anything is missing or difficult to understand. Advice is not plagiarism!
Your assignment:
Draw a simple map copied from the map provided below. Just concentrate on the linework now - we can add shading, text etc. next week. Put only your name on the map, in a corner. You might want to discard the first couple of attempts before settling on a finished product.
Step 1.
Design your map using a rough sketch on paper. Remember the specifications!
Step 2.
Set Document Properties befoere you start - under the File menu. Choose US letter size (it might default to A4, a European page size).Then draw a neatline - a rectangular box that surrounds your entire map. Your page can be longer horizontally (landscape) OR vertically (portrait). You choose what you prefer in Document Properties before you start drawing.
Set the stroke (line width) to the thinnest size available - THIS WILL BE STANDARD FOR ALL STRUCTURAL LINES, BOXES ETC. IN OUR PROJECTS. Make the neatline exactly 6.5" x 9" or 16.5 cm by 23.0 cm. Follow the TA's instructions on how to make a rectangle of a given size. Change the drawing orientation using 'page setup' under the File menu. To print a horizontal map you must also choose the proper orientation when you print.
If the map contains other rectangular boxes, to contain the actual map drawing, or a secondary map etc., add all those boxes now and work within them. Don't draw a map and then try to fit a box around it. Build a framework of boxes to establish the map layout, and then fill them. Even if you get rid of some of the boxes later, you might use them now to help plan the map layout. Don't use the neatline as the box holding your map - create a separate map box inside the neatline.
Step 3. Draw your map.
(remember the requirements (specifications) listed above)
Step 3 gives general instructions. Go to the bottom of the page for the specifications and image files to be used this term.
3A: Get the file and design the map.
We can't draw all maps freehand. Normally we trace from a background image to make sure the shapes and locations of features are correct. The image could be scanned from an existing source (e.g. a map in the Map Library) or downloaded from a map website. In this case the image(s) you need are given below.Find the file you need, move the pointer over the image you want, and click the right mouse button. A menu will appear allowing you to save the image ("save picture as"). Save it on your disk or on the computer. Now you can 'import' the saved file into a drawing, as follows:
First, start CorelDraw from the Start/programs menu (NOT by double clicking on the scanned file, which was created using different software). Select 'import' under the File menu. In the import window, find the file, one at a time if there are more than one; click 'import', then click on the drawing window to put the picture in your drawing. Next, adjust the size and position of the scan(s) until you are satisfied; use rough sketches to plan the map, as suggested above.
When designing your map, decide where the basic components will go: for example, the title, the main map, a small location map or other item if there is one, and a scale, legend etc. In later maps based on this one we will need space for a legend, so leave room for one now. Look at the map provided after you have placed it in your drawing, and think about how you want to arrange it on the page. For instance - landscape or portrait orientation? Centred on the page? Or to one side, leaving an empty space for a legend (on later maps), title, north arrow etc. I suggest you use a pencil and paper to sketch various possible layouts until you are satisfied.
Remember, the image you get is someone else's map. Its purpose is to give you a template to copy from, so the shapes on your map will be correct. Sometimes maps contain features you would not need for your map - just leave them out. Consider your map design again. To move a scanned image, click on it to make it the active object (the handles appear around it), then move the pointer INSIDE the scan and drag it across the screen. Experiment until your page layout looks reasonable. Remember to leave room for a title, scale etc.
You will draw over the scanned maps, then discard them. This is easier if you draw on a separate layer (as if on tracing paper). To create a new layer: click the Layer menu and choose "Add Layer". You can name the layer to remind you what is in each one, when you have several (a very good idea). You might have layers for the scan, a neatline/boxes layer, the map drawing, and the text. It's a good idea to open the layers window ('layers...' at the bottom of the layers menu) to keeop track of your layers. From that you can hide or show any layer, and lock or unlock any layer. Locking prevents accidental changes. Typically, lock all layers except the one you want to work on right now.
3B: Lay out the map, and draw it.
You have designed your map (see above!) - so start by drawing the neatline and any internal boxes you need according to your design - in other words, creating a foundation on which to build your map. Put these boxes in a layer of their ownIt also makes sense for each component (main map, location map, legend etc.) to be in its own layer.
Now create a new layer and trace over the scanned image(s) in the new layer. Then discard the scan(s). Finally, complete your map by adding your name. (We will do more next week - just do these today). To trace the map, use the Bezier drawing pen tool (NOT freehand pencil) to trace lines - coastlines, roads, rivers, park boundaries etc., whatever is in your map. Use it by moving the cursor around on the screen, clicking every time you want to mark a point. A chain of straight lines appears linking the points as you click on them. DO NOT hold the button down as you trace. The shape finishes if you get back to the beginning or change your tool. Practise first!
Tracing is easiest if you enlarge your map on the screen. Move around in an enlarged map by moving the drawing tool to the edge of the window.
When you are tracing complex shapes, such as the outline of Canada, simplify the outline or you will need all day to finish the job. You can always go back and edit it or tidy up afterwards, if you have time. You may find it easier to get a good fit at the edges of the map if you convert your traced shapes to very small line thickness later, zoom in and edit it. As you trace around the land or lakes, ensure that anything you want to shade is a closed polygon which can be filled with a colour or shade. DO NOT try to correct every mistake (there will be too many and you will never get finished). Simplify the shapes a bit. Omit smaller features if you like.
3C: Edit the drawing.
Edit your map if necessary. Choose the 'shape' tool from the toolbox. To correct errors in the shape of a polygon, click on it using the editing tool. The points (nodes) you defined to make the shape will appear on the screen. By clicking on any one and 'dragging' it, you can reposition the point. If you double click on the line between two nodes, you can create a new point, then use the editing tool to move it wherever you need it. This is really useful if you want to make a jagged outline look more rounded. To delete a point, select it with the shape tool and click the minus sign just above the tool bar.Editing like this can be used to create a better fit between the template and your drawing. It is best done on a substantially enlarged map. Outlines should not be too jagged and sketchy. Try to use enough points that they look reasonably realistic, but not such a large number that will take all day to draw. If your lab is taking hours to do, you are probably using too many points.
Grouping:
Suppose you want to move or rescale your entire map (or a scale bar
made up of several lines and labels) relative to the neatline (e.g.
to make the design more symmetrical). You can move any single shape
by selecting it and 'dragging'. It is very hard to move an entire map
one block at a time and reassemble it. It is more convenient to
select all the items you want, group them into a single unit, drag
that unit, then ungroup them so you can work on individual elements
again. To do this: hold down the Shift key on the keyboard and
click on each object in turn that you want to group together. A set
of handles will appear around the chosen objects and encompass them
all. OR - with nothing selected, place the selector arrow outside the map somewhere, and drag it over the map. Anything completely inside the rectangle you drag out on the screen gets selected. Then select Group from the Object menu.
Move the pointer to the object and drag the object to move it, or the handles to change shape or size. To avoid distorting the shapes, hold the control key down while you drag the handles.
All the features move together. Select Ungroup from the Object menu,
then click on the selection tool to de-select all of the
objects and be able to continue working.
Details of this term's lab:
After that background information, let's move on to the actual lab itself...
Your job: create a map by tracing from a scanned image. The subject this time is a map of Ottawa, showing districts which are called wards. We are not mapping streets, rivers etc., just the ward boundaries, except that north of the river, where no wards are shown, you may want to draw the river boundaries just to put something in that space. Later, we will add data about each of the wards in the city, but for now we are just making the base map. Remember: the purpose of the scanned image is to make shapes accurate. You are not trying to make an exact copy of it, and you don't have to copy every detail of the irregular boundaries. Draw the outlines but make sure you draw each shape as a complete, closed, separate outline.
Keep your drawing simple! - or it will take an impossible amount of time. Note that you do not need to click multiple times along a straight line. Once at each bend or line intersection is enough. Make each region a separate polygon so it can contain shading later. The required file for the main map is shown below:
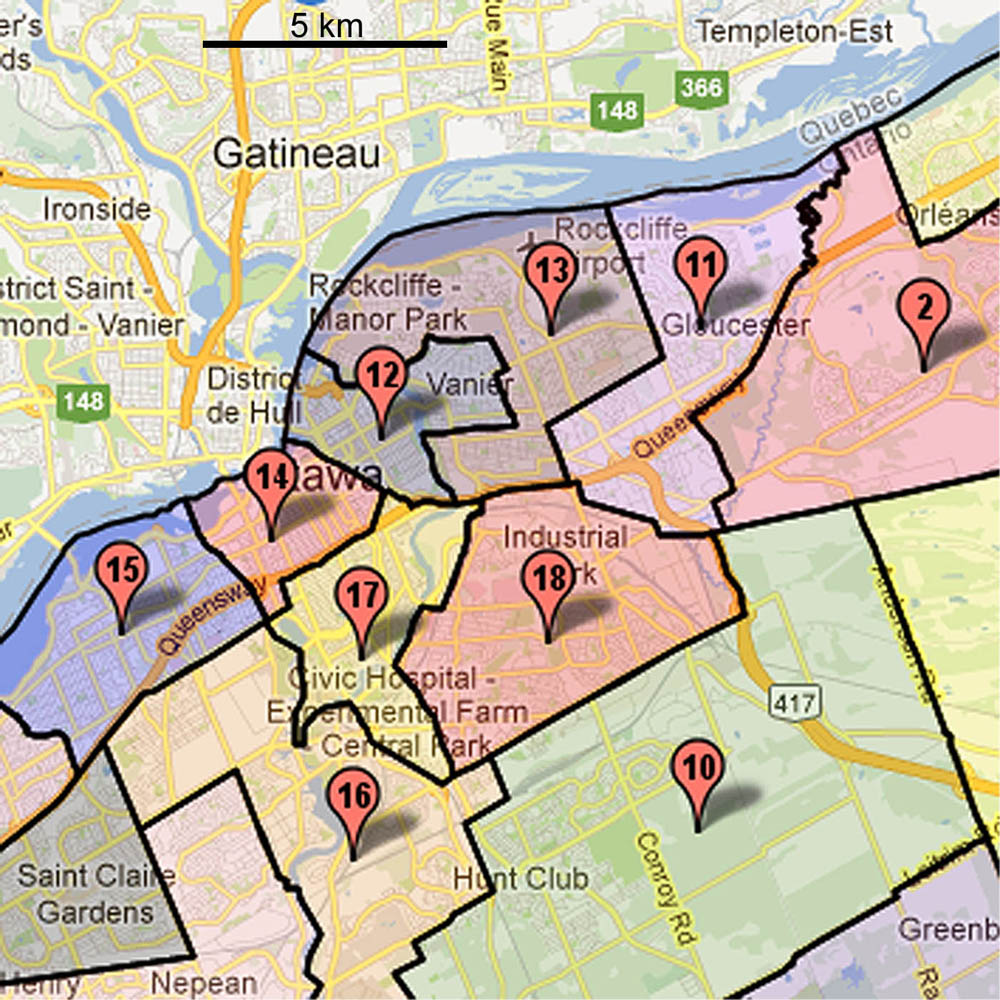
Source: UWO Department of Geography. Note... to save, right-click over the image to get the save menu.
Don't forget - the software which created the image you are using was done using another program, not from within Inkscape. Therefore you can't open Inkscape by clicking on the image file itself. Open Inkscape first, and then (from the 'File' menu) import the image, or just copy this image and paste it into Inkscape.
Adjust the size and position to fit your design.
Then make a new layer, trace the scanned image, drawing a simple map showing the outlines, boundaries etc. You do NOT have to copy everything. Simplify the outlines. Add a title and your name. If the drawing is not great at first, you can continue editing it in subsequent weeks.
Don't forget to trace the scale as well, but you can move it off the map, it doeas not have to stay where it is. . Then delete the extra map, you don't need it any more.
Options:
1. Add a small location map to show where the main map area is. This is optional! - but shows extra effort so it's a good thing. Most likely, show the whole of Ontario or a section of Eastern Ontario and western Quebec, showing where Ottawa is relative to the rivers, lakes and a few major cities. It is easy to find maps these days just by searching the web. Find a suitable small map, save it, and record where it came from (the web address, URL) so you can give credit for it on your map. NOTE: Don't just use that file as it is, put it in your map like you did the first map file, then redraw it very simply and delete the original file. Add a heavy (thick line) box around the area you are showing in the main map, or a prominent dot for the city. Keep it small and simple... and the space it occupies can be used for the legend in later maps.
2. Add names of the wards in a new layer. The names etc. are optional, but will earn extra marks. Just drawing the outline map is a minimum pass requirement. The names of wards can be found here:
Don't forget a title, your name, a scale and north arrow (north is at the top of the map).
Assessment:
Follow the basic routine outlined in the steps above. You will do better if these conditions are met:
(1) Lines which touch other lines stop at the right place (no gaps, no over-shoots). Where two lines meet make them meet exactly. This is easiest to do using the shape editing tool with great enlargement, and fairly thin lines. (2) The drawing is reasonably well done - not too jagged or messy, no obvious missing features etc. (3) Everything we asked for is done.
You have two weeks to do this assignment. Hand it in to your TA in the lab after two weeks.