Figure 1. Example of spot height (or point data) file. The values can be measurements other than elevation - e.g. temperature, pollution concentration. The dots are the actual points at which the measurements were made.
Start Inkscape, and open your file for Drawing Lab 1. We are going to add a contour layer to that existing base map. It's a good idea, right now before you have an accident with it, to go to 'File - save as' and save this file as 'Lab 4'. That way Lab 1 is retained in case you need it again.
If you didn't do this before, delete the scanned image that you traced from in Lab 4.
Make a NEW LAYER underneath everything in your old map. Lock the other layers, maybe hide them temporarily so they are not a distraction. While in the new layer, import the contour point data file in your new layer. Adjust its size to fit exactly under your map from Lab 1. This is easiest if you remove all the shading from the earlier map... select all the polygons and make them transparent. Adjust the size and position of the point data map to match up the coastline on the new scan to the coast on your map.
This new image consists of dots with numbers (similar to the picture below). These values are fictitious, but designed to be similar in nature to the real ones for this data. Your job is to draw isolines among the points. Draw them in another NEW LAYER above the layer with the point data. Then get rid of the point data layer. WARNING!!! If you don't work in a new layer it will be more difficult to get rid of the background point data map, and impossible to separate the contours from everything else.
Figure 1. Example of spot height (or point data) file. The values
can be measurements other than elevation - e.g. temperature, pollution
concentration. The dots are the actual points at which the measurements
were made.
Start by drawing a new internal box to contain the isoline map itself. This will exactly duplicate the internal box from the map you draw in the previous lab (in fact you can copy and paste it.) This internal box will contain nothing but the isoline map.
NOTE: Usually in our maps the internal box and the isolines will be drawn in VERY narrow lines. Sometimes in an isoline map we will specify that the isolines be drawn over a background map (e.g. temperature isolines over a background of lakes, provincial borders etc.) To help keep the two types of line (background map and isolines) separate, the background map is drawn very thin and the isolines slightly thicker. In this case you should use the same thicker line for the internal box.
Tip: You might find it easier to plan your contours if you print the file now (save it first). You can draw contours on the print to figure out where they should be, then draw them on screen with your drawing as a guide.
Draw your isolines (contours) as discussed in class. Draw isolines as polygons, so they can hold shading (next lab). Recall our discussion of contouring in class. NOTE: Each contour must be a polygon so it can contain shading!!! If it touches the side of the box, draw a line along the box to the other end of the line to close the polygon. Remember that contours cannot normally cross or even touch (they would touch only in the special case of a vertical cliff.) Draw with the polyline tool, not freehand, but add enough points that the curves are quite smooth. It is often useful to draw the shape quickly with very few points just to decide where it will go. Then you can go back and edit, adding other points to smooth out the line to make it look natural. You can experiment with the smoothing function as well.
Be careful about the order in which you draw - if you cover one contour with another by mistake, use 'order' under the Arrange menu to move things up and down until they are visible. It's often easier to start with the outermost contour and work inwards, and to make every contour transparent so they do not cover each other at first, then add shading and rearrange the order as needed.
Figure 2. A contour is drawn to represent the 300 m level. Since there are
two patches of higher land there are two separate contours. See how all the
points over 300 are inside the contours, all points below 300 are outside. Use
that as a check to make sure your contours are correct. You can see at once how
much uncertainty there is in the exact locations of the lines.
Figure 3. Another contour is added at the 250 m level. Check the
points - nothing below 250 should be inside the contour.
Figure 4. The full set of contours is finished. Note those
which touch the edge of the map box. The straight edge of
the box is PART OF THE POLYGON. The layer with the numbers is not deleted yet but that would be the next step.
Assessment:
Follow the basic routine outlined in the three steps above. Your mark (on the final portfolio version) will be better if these conditions are met:
(1) No spelling mistakes!!! (2) Make sure the contours are accurately and tidily drawn. Quality of drawing will be a factor in marking.
You have a week to do this basic contour drawing assignment. Have it ready to work on in the next class, where the other details are added. You don't hand it in until the following week.
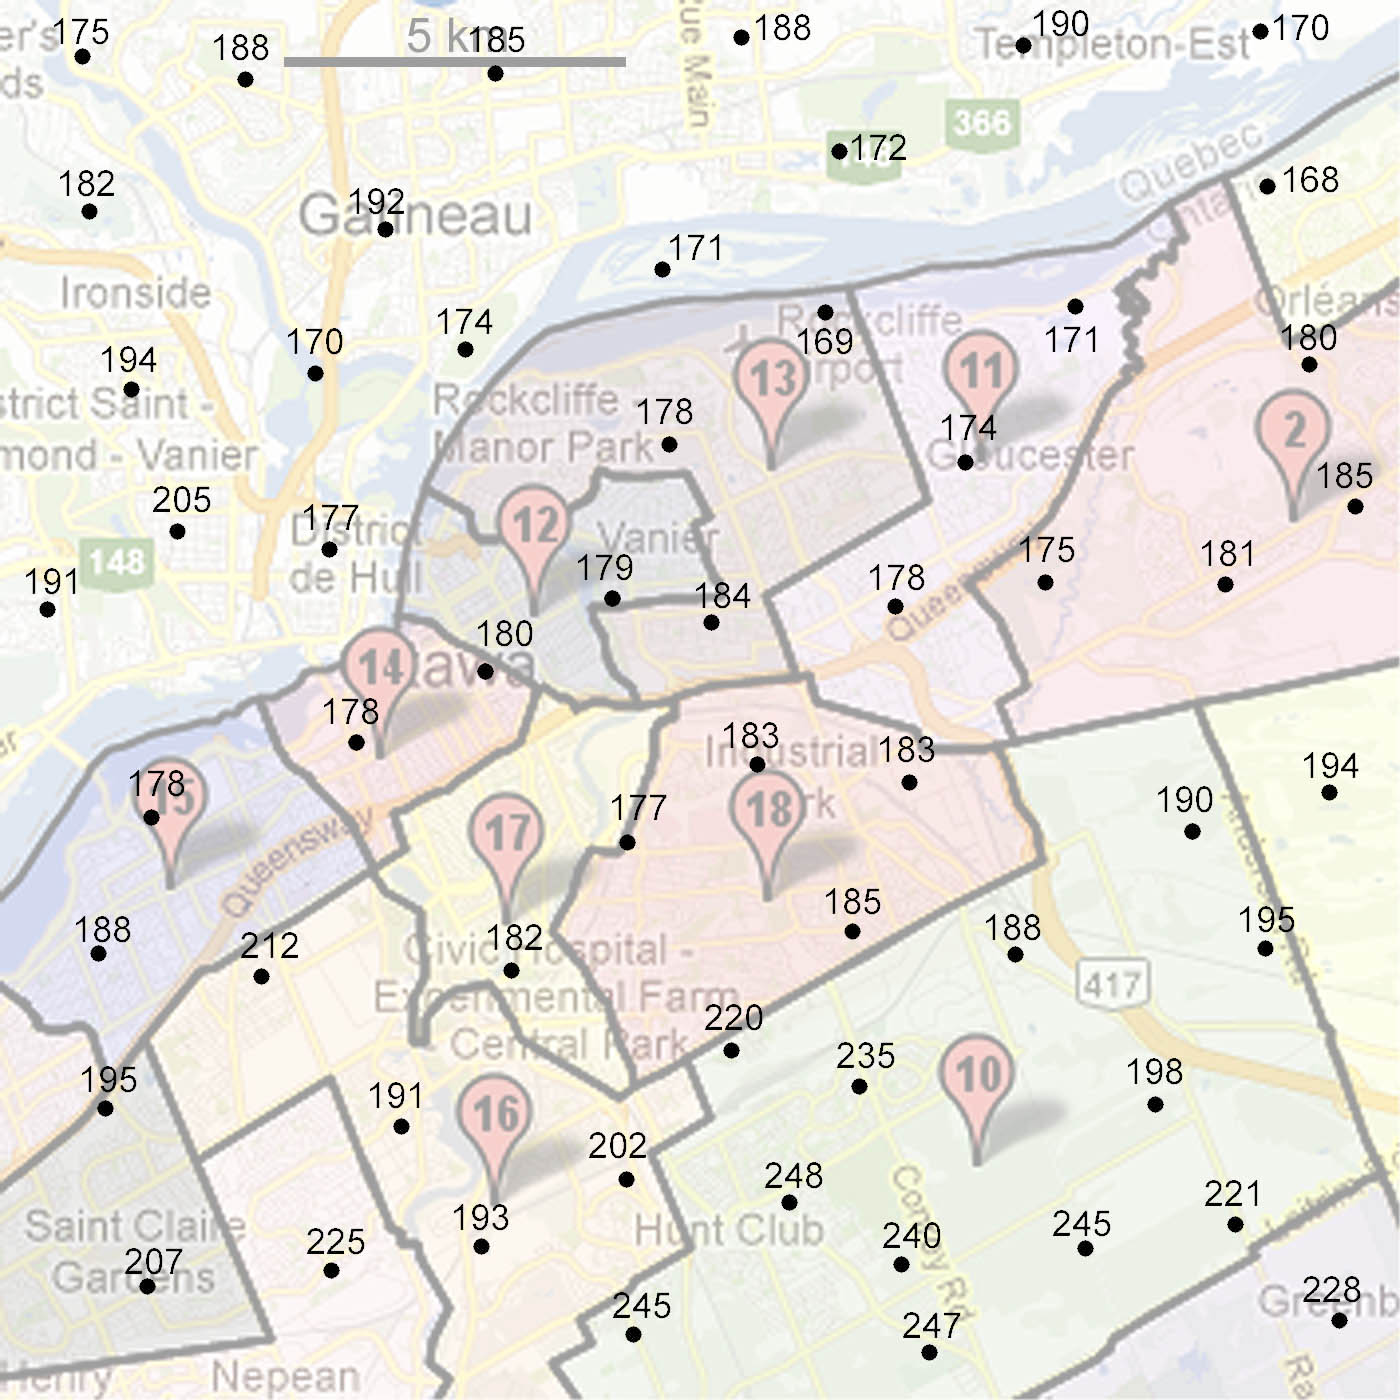
This is a fictitious dataset representing elevations in Ottawa, in units of metres above sea level. Note: The contour data covers the full area of the base map, extending across the river into Gatineau, unlike our earlier labs. To show the outline of the basemap just put your original outline map layer above the contour layer, converted to the thinnest line available, with no colour fill and no names. The contouring method is described above, and it will be discussed in lab. Use the data map shown below (ottawa-points.jpg).
Place the new map in your drawing - HINT: first, create a new layer under the base map drawing, lock all older layers! , and import the image into the new layer, fitting it into the box around your map - if you didn't draw a box around your map, draw one now because you will need it this time. Make the outlines in this map match your previously drawn outlines as closely as you can by adjusting its size and position. Then create a new layer for the contours (on top of the new image layer but under the old map layer) and start drawing contours. This way, the previous outline is on top of your contour layer. When the contour map is finished you can overlay the old drawing... see second part of this lab.
Use a contour interval of 10 m for this map, at levels of 170, 180, 190 etc. You may want to start by printing the map and figuring out the contours with a pencil before drawing on the screen. I suggest you start by drawing a looping line enclosing the highest area, then another one 10 m out from that, all the way to the end. When lines start to touch the box around your map, follow the edge of the box to complete the outline. As you draw each contour progressively down the range of elevations, it is bigger than the one before and when you put shading in it, it will cover the previous one. So as you draw each one, move it to the back of that layer. Shade them as you go so you can check they are working right. Any area left over after you finish drawing contours is shaded by putting the fill in the rectangle around the map.