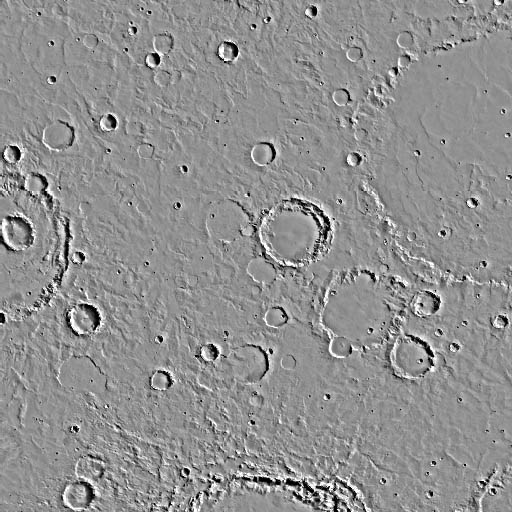
 Sabaeus Sinus (18 degrees south)
1. We will move on to Mars, but still try to find images with a range of crater densities. Try to find one each from an old cratered highlands area, a medium-age plains surface and a young smooth area. I suggest you use Map-A-Planet for this:
But... choose areas with relatively uniform crater density. If a boundary between heavily cratered and lightly cratered terrain runs through your area, your counting will mix up two different surface ages. You need enough craters to make it worthwhile, so for the smoother area, choose a larger region if necessary. We will normalize to 1 million square km so the different counting areas are not a problem.
Here are some examples:
Sabaeus Sinus (18 degrees south)
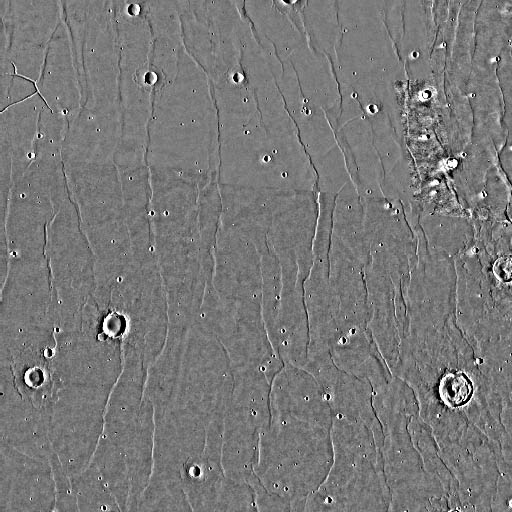 Lunae Planum (12 degrees north)
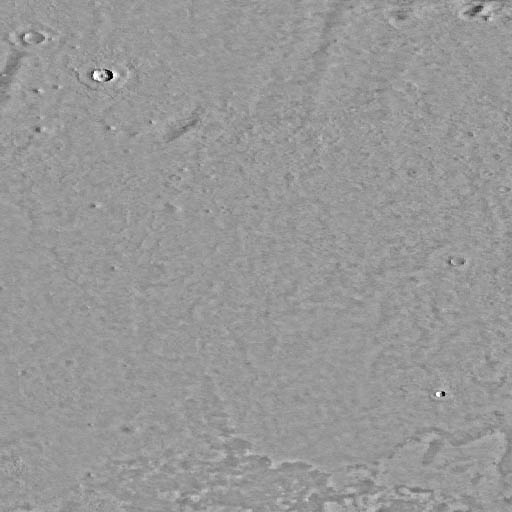 Amazonis Planitia (52 degrees north)
2. For each one, give basic location information and feature names if appropriate, website you obtained it from, and approximate dimensions of the image, showing how you determined the size.
A warning is needed here. These are photomosaic maps, not original images as we were using for the Moon. Each area I chose is in a standard map projection: Simple Cylindrical. Check the Map-a-planet result page - labels around the map give details not seen in my images. My maps are square, 8 degrees wide. One degree on Mars is about 60 km, giving us a rough size... except that meridians converge towards the pole. The areas are really trapezoidal, not square. The areas scale with the cosine of the map's midpoint latitude.
Example: if your area is 5 degrees across (N-S and E-W) with its centre at 48 degrees North, its area is (5 x 60 km) x (5 x 60 km) x cos(48).
3. Count craters in the size ranges shown on the graph, adjusted for a million square kilometer counting area. Tabulate results. Plot on a paper copy of the graph or via a spreadsheet or graphing program. Summarize your results briefly - what ages do you find, and are they reasonable or not?.
Hand in after 2 weeks (just before the reading break) - to instructor's office, under the door if he's not there.