Slide 4 of 21
Notes:
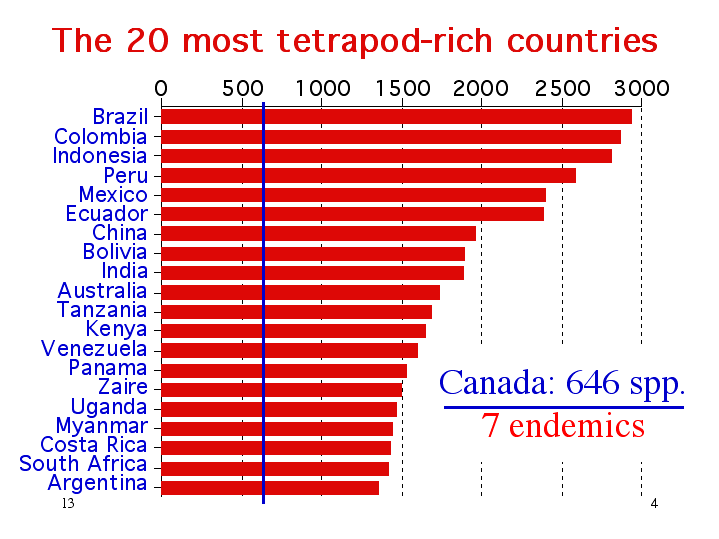
here we see several of the same countries as in plant figure….. seems that places rich in one element of the biota are often rich in others - SEE THIS IN OTHER GRAPHS SHOWN IN MANUAL.
What about the relationship between richness and endemism?
The plants graph showed that though the relationship isn’t tight, it suggested that it IS positive…………
Next we plot national richness vs. endemism, first for mainland nations…………. and then for island nations


