|
|
|
|
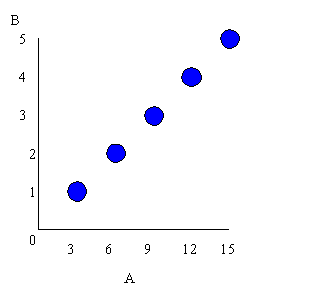
Correlation correlation is a much abused word/term correlation is a term which implies that there is an association between the paired values of 2 variables, where association means that the fluctuations in the values for each variable is sufficiently regular to make it unlikely that the association has arisen by chance assumes: independent random samples are taken from a distribution in which the 2 variables are together normally distributed example 1: variable A (income of family) (1000s of Swiss francs) variable B (# of autos owned)
Here there is a perfect and positive correlation as one variable increases in precisely the same proportion as the other variate increases
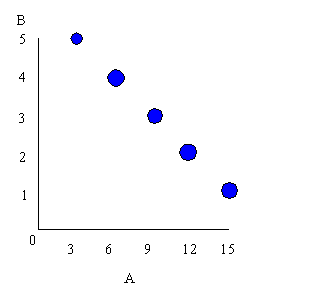
example 2 variable A (income of family) (1000s of Zambian pounds) variable B (# of children)
here is a perfect and negative correlation as one variate decreases in precisely the same proportion as the other variate increases
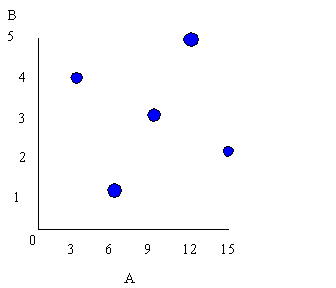
example 3 variable A (income of family) variable B (last number of postal code)
here there is almost no correlation because one variate does not systematically change with the other. Any association is caused by A and B being randomly distributed
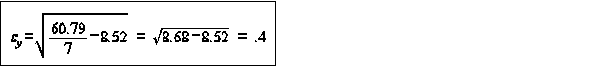
correlation is a method whereby a coefficient is calculated to describe the degree of association between sets of paired values, and then tested to determine the probability that the association might be due to chance variation ie. Can show there is only a 5% chance or less of the association being caused by a random influence - but this does not mean that one variables is causing fluctuations in the other no causal link can be deduced from a correlation alone- it requires other evidence and good judgement in the above examples example 1 - correlation coefficient =1 example 2 - correlation coefficient =-1 example 3 - correlation coefficient =0 the correlation coefficient for the parametric case is called the Pearson product moment correlation coefficient (r) it is powerful but data has to satisfy �normal� conditions calculation x,y are values of the 2 variables Sx, Sy are the sample standard deviation
data should be set up in a table to facilitate calculations
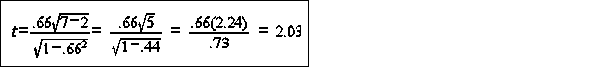
testing the significance of r H0: r is not significantly different than 0 H1: r is significantly different than 0 example
df=N-2 tcritical( "=0.05)=2.571 we must accept the null hypothesis
| |||||||||||||||||||||||||||||||||||||||||||||||||||||||||||||||||||||||||||||||||||||||||||||||||||||||||||||||||||||||||||||||||||||||||||||