

|
|
|
|
probability theory probability theory evolved out of practical considerations, i.e. gambling it’s the science of uncertainty probability - likelihood or chance of an occurrence of a particular event basic counting principles addition principle - method of determining number of elements in a set without actually counting each element example M is the set of males in Geog 201 and F is the set of females union of the 2 sets M ^ F is set of all studentssince the sets have no members in common the intersection M _ F is the empty setM and F are disjoint sets total number of students in the class is the number of elements in M ^ F and is given byn(M ^ F) = n(M) + n(F)this doesn’t work if some elements are shared between the sets example there are 22 environmental management majors students in Geog 201 and 16 urban development majors with seven of the students pursuing both areas if M denotes environmental management majors if U denotes urban development major then M _ U represents double majorsyou might think that all we need to do is add M and U to get 38 majors but this would be in error the double majors have been counted twice the correct answer is to subtract the double majors n(M ^ F) = n(M) + n(U) - n(M _ U)= 22 + 16 - 7 =31 so for any two sets A and B n(A ^ B) = n(A) + n(B) - n(A _ B)if the sets are disjoint n(A ^ B) = n(A) + n(B)example a survey of firms shows that 750 firms offer employee health insurance, 640 offer dental insurance, and 280 offer both How many offer health or dental? H - set of firms offering health D - set of firms offering dental insurance H ^ D - set of firm offering both health and dentalH _ D - set of firms offering health or dentalso n(H) = 750 n(D) = 640 n(H _ D) =280and n(H ^ D) = n(H) + n(D) - n(H _ D)= 750 + 640 - 280 = 1,110 Venn diagrams city has 2 newspapers the Sentinel and the Journal; a survey of 100 people shows: 35 people subscribe to the Sentinel, 60 subscribe to the Journal, and 20 to both a) how many subscribe to the Sentinel but not the Journal b) how many subscribe to the Journal but not the Sentinel c) how many do not subscribe to either can do this in a diagram
or a table
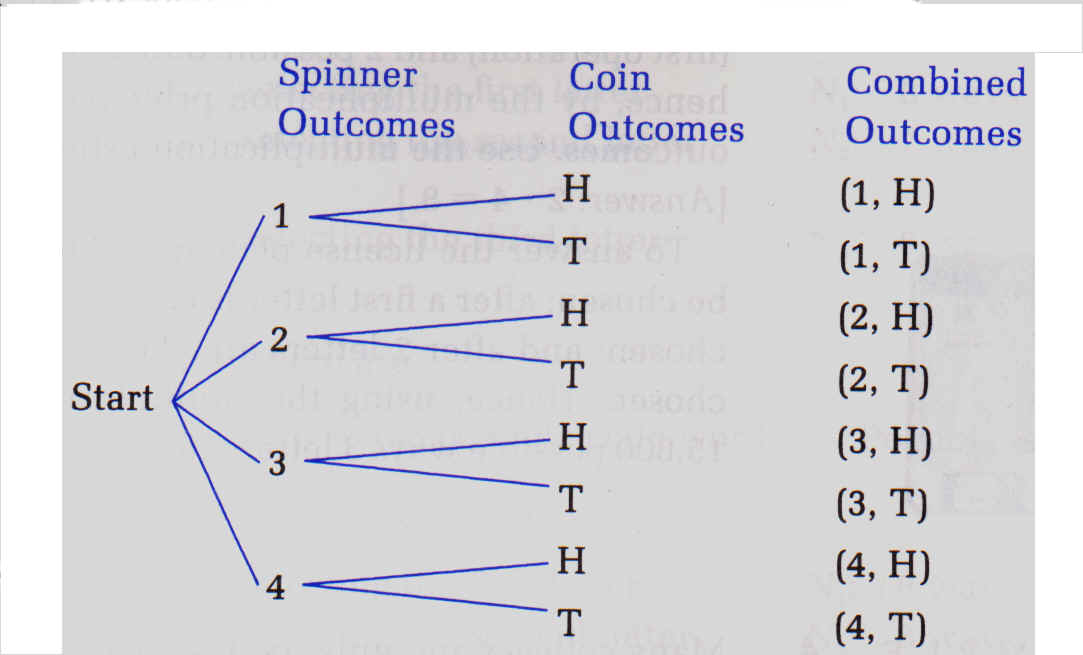
Multiplication principle
start with an example
suppose we have a spinner that can land on 4 numbers 1,2, 3 or 4. Then flip a coin that turns up either heads (H) or tails (T) what are the possible combined outcomes? so there are 8 possible outcomes now suppose you asked from the 26 letters of the alphabet how many ways can 3 letters appear in a row on a license plate if no letter is repeated? To do a tree diagram would be very tedious but we can use multiplication principle (for counting) If 2 operations O1 and O2 are performed in order, with N1 possible outcomes for the first operation and N2 for the second, then there are N1 @ N2 possible outcomes
this can be generalized to N1 @ N2 ..........Nn permutation
an arrangement of objects in a definite order, the same objects arranged in a different order constitute a different permutation
e.g. ABCD is different than DCBA
permutations (n,r) = # of permutations of n objects r at a time
note 1!=1 0!=1 e.g. 3 objects ABC taken 2 at a time possibilities AB, AC, BA, CA, BC, CB = 6 P(3,2) = 3!/(3-2)! = (3 x 2 x 1)/1 = 6/1 = 6
combinations- an arrangement of objects made without regard to the order of objects e.g. ABCD is the same as DCBA # of combination # # of permutations
e.g. c(3,2) = 3/2!(3-2)! = (3x2x1)/(2x1)x1=6/2=3 ab/ba ac/ca bc/cb probability - likelihood or chance of an occurrence of a particular event an event must have at least 2 outcomes examples of events event context possible outcomes coin toss experiment heads/tails flooding time flood/no flood retail store space present/absent
2 definitions of probability 1) objective / a priori - probabilities generated from objective reasoning e.g. throwing a die and getting a 2 = # of successful outcomes/# of possible outcomes = 1/6 =.1666 2) subjective / a posterior / relative - probabilities generated from experimentation/ history/ empirical study # of successes # of occurrences 23 times get a 2 # of trials # of events 120 die throws = .1916 this is a practical way of testing objective reasoning about probability of events example - a die was tossed by Wolf 20,000 times with the following frequencies - was the die fair?
source: Wolf R. (1882), Vierteljahressschrift Naturforsch. Ges. Zürich, 207,242 in geography it is very difficult to generate objective probabilities of events, most probabilities are subjectively derived e.g. # of earthquakes 2 # of years of data 100 = 0.02 if we want expect probabilities to be accurate then we need a very long run of historical data, in other words we want to generate probability statements based on a large set of observations as the number of trials increases, the proportion of occurrences approaches a limiting value or probability
predictability: although we can establish probabilities for events that doesn't mean we know whether or not a particular outcome will occur we may know that there is only a 2% chance of an earthquake in any year but we don't know what year it will occur this is because earthquakes are produced by a stochastic process ˆ individual events are subject to random processes/influencesbut probability is very useful in planning for catastrophic events P =0 - event never occurs P=1 event always occurs for an outcome A 0.0 # P(A) # 1.0
addition law - used to compute probability of an event A or B if A and B are outcomes of a given event and are- then the probability of EITHER outcome is the sum of their individual probabilities e. coin toss A=heads B=tails addition law P(A or B) = P(A) + P(B) = 0.5+0.5 = 1
e.g. flood A=no flood B= flood of 5cm C=flood of 10cm P(A or B or C) = P(A) + P(B) + P(C) = 0.7+0.2+0.1 = 1
General theorem P(A) + P(B) -P(A and B)
e.g. for 1000 households, where do you shop, what mode?
suburbs city centre mode=car 150 650 800 mode=walk 150 50 200 total 300 700 1000 probability of suburban trip 300/1000 = 0.30 probability of trip by car = 800/1000 = 0.80 probability of A or B P(A or B) = 0.30+0.80 = 1.1
ERROR!!! probability of suburban trip and probability of trip by car (P(A), P(B)) are NOT independent events/mutually exclusive events of the 300 trips to the suburbs, 150 are by car ˆ 150 trips are double countedsubtract the probability of a suburban trip and probability of a car trop e.g. P(A or B) =(0.30+.80-0.15)=.95
if A and B are 2 possible outcomes of events that are independent then: P(A and B) = P(A) x P(B) (multiplication rule) example probability of a crop loss in a given year =0.16 what is the probability of crop losses in 2 successive years the events (crop loss in a year) are independent of each other
ˆ P(crop loss in year 1 and year 2)=0.16 x 0.16 = 0.0256
e.g.. dice throw of a 12 P(first 6 and 2nd 6) = 1/6 x1/6 =1/36 = .02777
probability of an event occurring = P(a) then the probability of A not occurring is 1 - P(A)
e.g. crop loss=0.16 ˆ no crop loss = 0.84
what if events A and B are not mutually exclusive P(A and B) = P(A/B) x P(B) e.g. order events if wheat occurs in location 1, it affects the probability of corn ˆ not mutually exclusive
P(wheat in area 1) = 1/3 =0.333 P(corn in area 2, given wheat in are a 1) =1/2 = 0.5 this is a conditional probability Y prob. of corn given wheat in area 1P( corn and wheat) = P(corn given wheat) x P(wheat) A = corn, B=wheat P(A and B) = 0.5 x 0.333 = 0.1665
example suppose there are 50 cereal boxes on a shelf 30 are red and 20 are blue pick a random sample of 2 boxes without replacement what is the chance the second box in the sample is blue? 2 ways to pick a sample so that the blue box is the second item a) 2 blue boxes b) 1 red and 1 blue probability of 2 blue is P(1st pick blue) x P(pick blue if 1st is blue) 1st pick blue is simply 20 out of 50 pick blue if 1st is blue is the conditional probability based on picking blue first P = (2/5)(19/49) probability of red then blue P(1st pick red) is 30 out of 50 P(pick blue if 1st pick red) = 20/49 ˆ the probability of the second box being blue isP(1st pick blue) x P(2nd pick blue if 1st blue) + P(1st pick red) x P(2nd pick blue if 1st red) = (2/5)(19/49) + (3/5)(20/49) = 2/5 or .40
another example using boxes covered with construction paper problem 1: given 9 boxes, 5 orange 4 green, what is the probability the second box you pick will be green?
2 outcomes a) 1st pick red then green 5/9 x 1/2 =5/18 b) 1st pick green then pick green 4/9 x 3/8 = 12/72 total probability is a) + b) = 5/18 + 1/6 = 8/18 = 4/9 problem 2: add 1 yellow box to sample to make 10 boxes now what is probability of getting 2nd box green? 2 possible ways to solve 1 way 3 outcomes a) 1st orange then green 1/2 x 4/9 = 4/18 b) 1st yellow then green 1/10 x 4/9 = 4/90 c) 1st green then green 2/5 x 1/3 = 2/15
common denominator is 180 so 40/180 + 8/180 + 24/180 = 72/180 = 2/5
2nd way treat boxes a green or not green a) not green 1st then green 3/5 x 4/9 = 12/45 b) green 1st then green 2/5 x 1/3 = 2/15 common denominator is 45 so 12/45 + 6/45 = 18/45 = 2/5
| ||||||||||||||||||||||||||||||||||||||||||||||||||||||||||||||||||||||||||||