DEPARTMENT OF EARTH SCIENCES UNIVERSITY OF WESTERN ONTARIO
COURSE OUTLINE
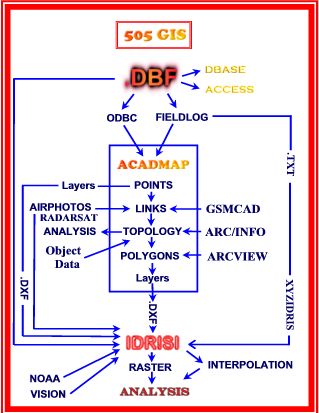
A Geographic Information System is a computer-assisted system for the acquisition, storage, analysis (derivative mapping, cartographic and process modeling), and display of spatially referenced data. The system employed in this course is however designed specifically for the geologist/hydrogeologist/geophysicist, and is an extension of the normal methods of analysis of the patterns of geological and geophysical data derived from field mapping and the examination of aerial photos and satellite, gravity, magnetic, and radiometric images.
While providing a general introduction to the principles and methodology of Geographic Information Systems as applied to Earth Science, the course will emphasize the practical aspects of setting up a mapping program and establishing a data management system. In as much as the course is largely lab-based, ample opportunity will be provided for hands-on experimentation with a number of GIS software applications as they might be used in both custodial and project related programs of geological mapping, mineral potential mapping, resource evaluation, and hazard and environmental assessment.
Students will first learn the fundamental difference between the raster and vector methods of portraying images, the file structures of the two kinds of images, the concept of paletttes, and the means by which one kind of image can be converted to the other. This will be followed by an examination of coordinate systems, map projections, and the nature of vector images in the form of digital national base maps generated by national and provincial mapping agencies, and how they can be used along with aerial photographs, and existing hard copy geological maps to set up a mapping program. The use of GPS in the electronic determination of coordinate locations will logically lead into the section dealing with the collection and storage of spatial data in various database systems, the drawing of geological maps, and the concept of topology. The course will then deal with the raster characteristics of digitized aerial photographs (image enhancement) and remote sensed images, and their use in cartographic modelling and image analysis.
Software packages used in the course include AUTOCAD
MAP (+ FIELDLOG) and GSMCAD for
vector based systems, and IDRISI for raster
based systems. Consideration will also given however to the methodologies
employed by ARCVIEW-ARC/INFO and
VISION,
and exercises are provided illustrating the portability of spatial data
between these various systems. High-end raster image systems such
as PCI and ERMAPPER
will also be demonstrated using Radarsat datasets
for the Sudbury region. Please note that the course is not meant to be
a general primer in the use of Autocad Map, IDRISI, ArcView, Arc/Info,
Vision, PCI or ERMAPPER, and only those components relevant to the Geology/Geophysics
theme of the course are treated in detail. No consideration is given to
ATLAS, MAPINFO, MICROSTATION, TNT, or INTERGRAPH. Choice of software is
largely governed by software cost, and useage of the software by Canadian
Federal and Provincial Geological Surveys, the Ontario oil industry, and
Canadian mining companies.
(see also Manifold at http://www.manifold.net/news/news_set.html
)
In preparation for the final examination, the concluding part of the course will involve several intensive coaching sessions designed to firmly fix the concepts and terminology used in all forms of data management, data visualization, and visual data analysis.
Disclaimer: although now two-years old, this course nevertheless remains very much in the development stage, and is therefore incomplete in terms of content, design, and pedagogical construction. The author therefore welcomes constructive suggestions concerning the organisation of the course, and the correction of any errors of fact, logic, or syntax. Please do not be shy!
This web pages at this site were constructed using Microsoft Word (text), Netscape Composer (tabs, colour, links) , Wordpad (html editing), Microsoft PhotoEditor and Microsoft PhotoDraw (graphics).
CLICK HERE TO GO TO MODULE 1.
TEST YOUR KNOWLEDGE - What do you know about
Vector and Raster images?
Click here to return to lecture list
CLICK HERE TO GO TO MODULE 2
Click here to return to lecture list
LINKS TO
COORDINATE CONVERSION SOFTWARE
http://mac.usgs.gov/mac/isb/pubs/pubslists/fctsht.html
http://www.ngs.noaa.gov/PC_PROD/pc_prod.shtml#UTMS
http://everest.hunter.cuny.edu/mp/software.html
http://users.skynet.be/tandt/
http://cousin.de/kkisbin/trafo.tcl
CLICK HERE TO GO TO MODULE 3
TEST YOUR KNOWLEDGE - What do you know about
ONTARIO DIGITAL BASE MAPS
Click here to return to lecture list
CLICK HERE TO GO TO MODULE 4.
TEST YOUR KNOWLEDGE - What do you know about
DIGITAL BASE MAPS
Click here to return to lecture list
CLICK HERE TO GO TO MODULE 5.
TEST YOUR KNOWLEDGE - What do you know about
DLG's and DEM's?
Click here to return to lecture list
CLICK HERE TO GO TO PDF FILE.
Click here to return to lecture list
see Geologic Mapping and Collection of Geologic Structure
Data with a GPS
Receiver and a Personal Digital Assistance (PDA) Computer
by Gregory J. Walsh1, James E. Reddy, and Thomas R. Armstrong
http://pubs.usgs.gov/openfile/of99-386/walsh.html
TEST YOUR KNOWLEDGE - What do you know about
GPS?
Click here to return to lecture list
Using
Autocad Map to georegister base maps, geological maps, aerial photographs,
satellite images and geophysical data in preparation for a exploration
mapping program.
FILES:
no .rtf file
CLICK HERE TO GO TO MODULE 8.
TEST YOUR KNOWLEDGE - What do you know about
Georegistration?
Click here to return to lecture list
The
storage and organization of point source geological attributes using the
GSC developed stand-alone software FIELDLOG v. 2.83; importing ascii comma
delimited surface or bore hole data files (200a.dat and 200b.dat) into
Fieldlog; setting symbol defaults; exporting DXF files and drawing maps
with CorelDraw.
FILES: c:\aacrse\505\acad\flogdos.rtf
(13)
CLICK HERE TO GO TO MODULE 9.
CLICK HERE TO GO TO FIELDLOG V2.83 EXERCISE.
TEST YOUR KNOWLEDGE - What do you know about
relational databases?
Click here to return to lecture list
CLICK HERE TO GO TO MODULE 10.
TEST YOUR KNOWLEDGE - What do you know about
FIELDLOG?
Click here to return to lecture list
CLICK HERE TO GO TO MODULE 11.
CLICK HERE TO GO TO NOTES ON THE NORMIN DATABASE.
CLICK HERE TO GO TO THE ARCVIEW MODULE.
TEST YOUR KNOWLEDGE - What do you know
about IMPORTING DATA INTO FIELDLOG?
Click here to return to lecture list
see also
North American Data Model for Geologic Maps:
http://geology.usgs.gov/dm/
Digital Mapping Techniques 99
http://www.uwex.edu/wgnhs/dmt.htm
Digital Mapping Techniques 2000
http://www.uky.edu/KGS/mapping/mapping.html
CordLink Info
http://pubs.usgs.gov/openfile/of99-386/brodaric1.html
CordLink Site
http://132.156.108.208/Cordlink1/
OGS
http://www.gov.on.ca/MNDM/MINES/OGS/mmdogse.htm
OGS Digital Data
http://www.gov.on.ca/MNDM/MINES/PUB/digcat/erlis.htm
OGS Operation Treasure Hunt
http://www.gov.on.ca/MNDM/MINES/oth/index.htm
NGSC Publications for Canada
http://ntserv.gis.nrcan.gc.ca/
CLICK HERE TO GO TO MODULE 12.
TEST YOUR KNOWLEDGE - What do you know about GSMCAD?
Click here to return to lecture list
CLICK HERE TO GO TO MODULE 13a. - Autocad drawing
tools
CLICK HERE TO GO TO MODULE 13b. - drawing exercise
CLICK HERE TO GO TO MODULE 13c. - using the
tablet
CLICK HERE TO GO ARCVIEW
TEST YOUR KNOWLEDGE - What do you know
about DRAWING SPAGHETTI MAPS USING AUTOCAD?
Click here to return to lecture list
CLICK HERE TO GO TO MODULE 14 - ACCESS.
CLICK HERE TO GO TO MODULE 15 - EXCEL.
TEST YOUR KNOWLEDGE - What do you know about
LINKING AUTOCAD DRAWING OBJECTS TO AN EXTERNAL DATABASE?
Click here to return to lecture list
CLICK HERE TO GO TO MODULE 16.
CLICK HERE TO GO TO MAP ANALYSIS EXERCISE.
TEST YOUR KNOWLEDGE - What do you know about
TOPOLOGY
Click here to return to lecture list
CLICK HERE TO GO TO MODULE 17.
TEST YOUR KNOWLEDGE - What do you know
about pseudocolouring?
Click here to return to lecture list
Cartographic
modelling and Boolean images (ASSIGN; RECLASS; OVERLAY; GROUP; AREA).
FILES: c:\aacrse\505\idr\ex5\id5geo.rtf
(2)
CLICK HERE TO GO TO MODULE 18.
TEST YOUR KNOWLEDGE - What do you know
about CARTOGRAPHIC MODELLING?
Click here to return to lecture list
Principles
of remote sensing - the integration of Landsat TM, radar, and geomagnetic
images.
FILES: c:\aacrse\505\remote\remote.rtf
(8); satellite and magnetic imagery of the SUDBURY basin.
CLICK HERE TO GO TO MODULE 19.
TEST YOUR KNOWLEDGE - What do you know about
REMOTE SENSING?
Click here to return to lecture list
CLICK HERE TO GO TO MODULE 20.
Click here to return to lecture list
CLICK HERE TO GO TO MODULE 21.
CLICK
HERE TO GO TO ARCVIEW.
TEST YOUR KNOWLEDGE - What do you know
about LINKING RATER IMAGES TO AN EXTERNAL DATABASE?
Click here to return to lecture list
Digital
Geological Map of Canada - ARC/INFO, ARCVIEW viewing software.
FILES: c:\aacrse\505\gscmap\gscmap.rtf,
DBSTRUC.rtf (20), FILESDF.rtf (21)
also used in course 300B 'Geological Evolution of
North America'.
CLICK HERE TO GO TO MODULE 22.
Click here to return to lecture list
CLICK HERE TO GO TO MODULE 23.
TEST YOUR KNOWLEDGE - What do you know about
ARC/INFO - AUTOCAD MAP CONVERSIONS?
Click here to return to lecture list
CLICK HERE TO GO ARCVIEW NOTES MODULE 24
see also:
http://www.esri.com/software/arcview/whatsnew.html
TEST YOUR KNOWLEDGE - What do you know about
ARCVIEW?
Click here to return to lecture list
CLICK HERE TO GO TO MODULE 25.
TEST YOUR KNOWLEDGE - What do you know
about CONVERTING VECTOR OBJECTS TO IDRISI VECTOR OBJECTS?
Click here to return to lecture list
CLICK HERE TO GO TO MODULE 26.
TEST YOUR KNOWLEDGE - What do you know
about INTERPOLATION?
Click here to return to lecture list
CLICK HERE TO GO TO MODULE 27.
Click here to return to lecture list
CLICK HERE TO GO TO MODULE 28.
Click here to return to lecture list
CLICK HERE TO GO TO MODULE 29.
Available only as an explanatory file written by M.
Bedward
Click here to return to lecture list
CLICK HERE TO GO TO MODULE 30.
Available as an info file written by Pedro Pereira
Gonçalves
Click here to return to lecture list
CLICK HERE TO GO TO MODULE 31.
AVAILABLE AS A .PDF FILE
Click here to return to lecture list
CLICK HERE TO GO TO MODULE 32.
Click here to return to lecture list
The
NASA WEB course in Remote sensing
(http://code935.gsfc.nasa.gov/Tutorial/TofC/table.html)
Canadian
Centre for Remote Sensing WEB Tutorial
(http://www.ccrs.nrcan.gc.ca/ccrs/eduref/tutorial/indexe.html)
The
Murnion ARCINFO web course.
(http://boris.qub.ac.uk/shane/arc/ARChome.html)
The Short NASA Web remote sensing course (http://www.sbg.ac.at/geo/idrisi/Remote_Sensing_Tutorial/code935.gsfc.nasa.go v/IIFS-html/LT/NewTutorial/intro1.html)
Click here to return to lecture list
REFERENCE TEXTS:
Avery, T.E. & Berlin, G.L. 1992. Fundamentals of Remote Sensing and Airphoto Interpretation, 5th Ed., MacMillan Pub. Co., 472 p.
Bonham-Carter, G.F. 1994. Geographic information systems for geoscientists. Computer Methods in the Geosciences, v. 13, Pergamon. (principal text)
Drury, S. 1993. Image interpretation in Geology. Chapman and Hall, London.
Eastman, R.J. 1994. IDRISI - manuals. Clark University Graduate School of Geography.
Jensen, J.R. 1995. Introductory Digital Image Processing, a remote sensing perspective, 2nd edition. Prentice Hall Series in Geographic Information Science.
Lillesand, T.M. and Kieffer, R.W. 1993. Remote Sensing and Image Interpretation, 3rd Ed. J. Wiley & Sons, 720 p.
RadarSat International 1997. RADARSAT Geology Handbook.
Sabins, Jr., F.F. 1987. Remote Sensing: Principles and Interpretation. 2nd Ed. W.H. Freeman & Co., 449 p.
Selected Bibliography, Geology and Mining
Anonymous. Feb. 8, 1993. Geo-haz Consultants. Summary of Procedures to Produce a Landslide Susceptibility Map. p. 1-2.
Anonymous. Sept. 1992. Computers and Mining. Gibbs Associates Vol. 8, no 1.
Anonymous. May 1992. Geographic Analysis Software. Coal magazine. p. 60.
Krist, Frank J., Daniel G. Brown. Sept. 1994. GIS Modeling of Paleo-Indian Period Caribou Migrations and Viewsheds in Northeastern Lower Michigan. PE&RS, Vol. 60, No. 9, p. 1129-1137.
McCalpin, James P. Jan. 1993. The Professional Geologist. Geohazards Mapping and Geographic Information Systems, Vol. 30, No. 1, p. 5-6.
Memmi, John M. Feb. 1995. Expertise and GIS Converge for Diamond Exploration. GIS World, Vol. 8, No. 2, p. 54-55.
Teeuw, Richard M., 1995. Groundwater Exploration Using Remote Sensing and a Low-Cost Geographical Information System. Hydrogeology Journal, Vol. 3, No. 3, p. 21-30.
Software kindly made available by the Ontario Geological Survey under the Survey's Digital Data Royalty Licence Agreement:
Data Set 6 Bedrock Geology of Ontariobedseam.dxf
Data Set 11Tectonic AssemblagesTecseam.dxf
Data Set 12 Township and Areas of Ontario Lambert Conf.- Ont_lamb.dxf; UTM - Twp_z15,16,17,18.dxf
Data Set 13Drill Hole DatabaseASCII text files
Data Set 22 Topographic Map of OntarioBaseseam.dxf
Data 36 Geological compilation of the Timmins area, Abitibi Greenstone beltUTM NAD1927 1:20,000
ERLIS data set 1009Airborne Mag. and Electromag data for the Wawa area, Dighem III, CENTURION Data Display
MAP PROJECTION SPECIFICATIONS FOR LAMBERT CONFORMAL - OGS Data set 12
The Township and Areas were digitized from hardcopy 1:50,000 scale NTS maps and assembled into an Ontario-wide fabric in Lambert Conic Conformal map projection. The following parameters define the planimetric reference grid:
Clarke 1866 ellipsoid a=6, 378,206.4 (equatorial radius) e=0.006768658 (eccentricity squared)
Standard parallels 49 degrees N latitude 77 degrees N latitude
Origin 92 degrees W longitude 0 degrees N latitude; Central Meridian 92 degrees W longitude
False Easting 1,000,000 metres
MAP PROJECTION SPECIFICATIONS FOR LAMBERT CONFORMAL - GSC, Geological Map of Canada
Lambert Conformal Conical Projection parameters
Type
Lambert Conformal Conic projection
Datum
North American Datum 1927 (NAD27)
Units
metres
Spheroid
Clarke, 1866
Lambert
standard parallels
49 00 00 N
77 00 00 N
Projection origin
95 00 00 W (central meridian)
49 00 00 N
False origin
(easting, northing)=(0, 0)
Click here to return to lecture list
GEOSTATISTICS
- GSTAT
Gstat is a computer program
for geostatistical modelling, prediction and simulation, copyright 1992,
1998 (C) Edzer J. Pebesma. The Gstat program is free software and can be
redistributed and/or modified under the terms of the GNU General
Public License as published by the Free Software Foundation. Information
about the source code and documentation of Gstat are available at: http://www.geog.uu.nl/gstat/
Idrisi32 provides three interactive interfaces to Gstat functions:
1. Spatial Dependence
Modeller
2. Model Fitting
3. Kriging and Simulation
Exploratory Data Analysis
In addition to the
variogram modelling options in the Spatial Dependence Modeler and Gstat,
other Idrisi32 modules have been revised to provide better support for
geostatistical analysis. These include interactive displays, histogram
analysis (HISTO), moving window statistics (via a new version of the FILTER
module), spatial autocorrelation assessment (AUTOCORR), trend analysis
(TREND) and scattergram analysis (SCATTER).
The most fruitful exploratory data analysis is achieved by viewing and describing a data set through a variety of means, and reviewing such representations in light of other ancilliary information known about the sampled phenomenon.
Spatial Dependence
Modeler
The Spatial Dependence Modeller is an
interactive interface that accesses a combination of Clark Labs and Gstat
functions for creating h-scatterplots, surface variogram models, directional
variogram models, and additional summary statistics. Spatial continuity
can be modelled using the following methods: semivariogram (moments estimator
or Cressie robust estimator), covariogram, correlogram, cross variogram,
cross covariogram, or cross correlogram. Results can be saved and copied
to documents. Data transformations allow on-the-fly application of the
log transform, standard, and indicator transform.
Variograms can be
omnidirectional or directional. An omnidirectional variogram combines all
possible directions (i.e., all sample pairs) in a single variogram. It
can be represented as a curve, or it can be extended to create a surface
variogram (grid). The figure above shows both the surface and the
directional variograms. The raster grid represents
statistical space in which lag distance zero is located in the center and
lag distances increase outward in all directions. The attribute of each
pixel represents an average of variogram values for the particular distances
and directions (i.e. separation vectors) defined by the pixel location.
Lag separation distances can be regularly or irregularly spaced. The surface
representation may be used to determine the maximum and minimum directions
of spatial continuity.
Model Fitting
The Model Fitting interface allows for
interactive fitting of different mathematical structures to the variogram.
Ten structure types are available: spherical, exponential, gaussian, linear
with sill, linear, power, logarithmic, circular, pentaspherical, and periodic.
The fitting method algorithms accessed in Gstat include Weighted Least
Squares, Weighted Least Squares with normalized weights, and Restricted
Maximum Likelihood (REML).
The top graph of the interface reflects the model to be fit and geometric anisotropies (when present), while the lower graph serves as a visual tool for viewing the independent structures. The three independent structures provided can be used for modeling nested structures, including zonal anisotropies.
Kriging and Simulation
The Kriging and Simulation interface provides access to simple and ordinary kriging and cokriging, stratified kriging and Gaussian conditional and unconditional simulation (including multiple simulations). It includes data transformation (log and standardization), multiple methods for setting the neighborhood parameters for local kriging interpolation, and cross-validation of the sample data. A mask image can be used to limit regions to be interpolated. In addition, this mask image can identify regions (called strata) to be interpolated separately.
References:
Conditional simulation and the value of information, In: Geostatistics for the next Century, R. Simitrakopoulos (ed.), Kluwer Academic Publishers, 209-217, 1994, (Solow, A.R. and Ratick, S.J.).
A Method for Incorporating Topographic Uncertainty in the Management of Flood Effects Associated with Changing Storm Climate, Phase I report to: the U.S. Department of Commerce, Economics of Global Change Program, National Oceanographic and Atmospheric Administration, April, 1994. (S. Ratick, A. Solow, J. Eastman, W. Jin, H. Jiang).
Assessing the Vulnerability of Coastal Communities to Extreme Storms: The Case of Revere, MA., USA, Mitigation and Adaptive Strategies for Global Change 3: 59-82, 1998. (G. E. Clark, S. C. Moser, S. J. Ratick, K.Dow, W.B. Meyer, S.Emani, W. Jin, J. X. Kasperson, R.E. Kasperson and H.E. Schwartz).